
Bioclimatic Section
The representation of environmental data in our work is becoming more prominent as the urgence of the climate crisis reaches its peak. This is why, as designers of the built environment, it’s important for us to consider environmental factors in our proposals and convey these from the early stages of our design process.
In today’s tutorial, we’ll be running through how to produce a simple bioclimatic section to graphically represent the environmental conditions of your site.
Obtain Your Section
First, you need to get a clean section of your site, which may include your proposal depending on what stage of the design process you’re at. If you already have your section, you can skip to the next part of the tutorial.
For this tutorial, you need to have your site model ready to go on Rhinoceros 3D.
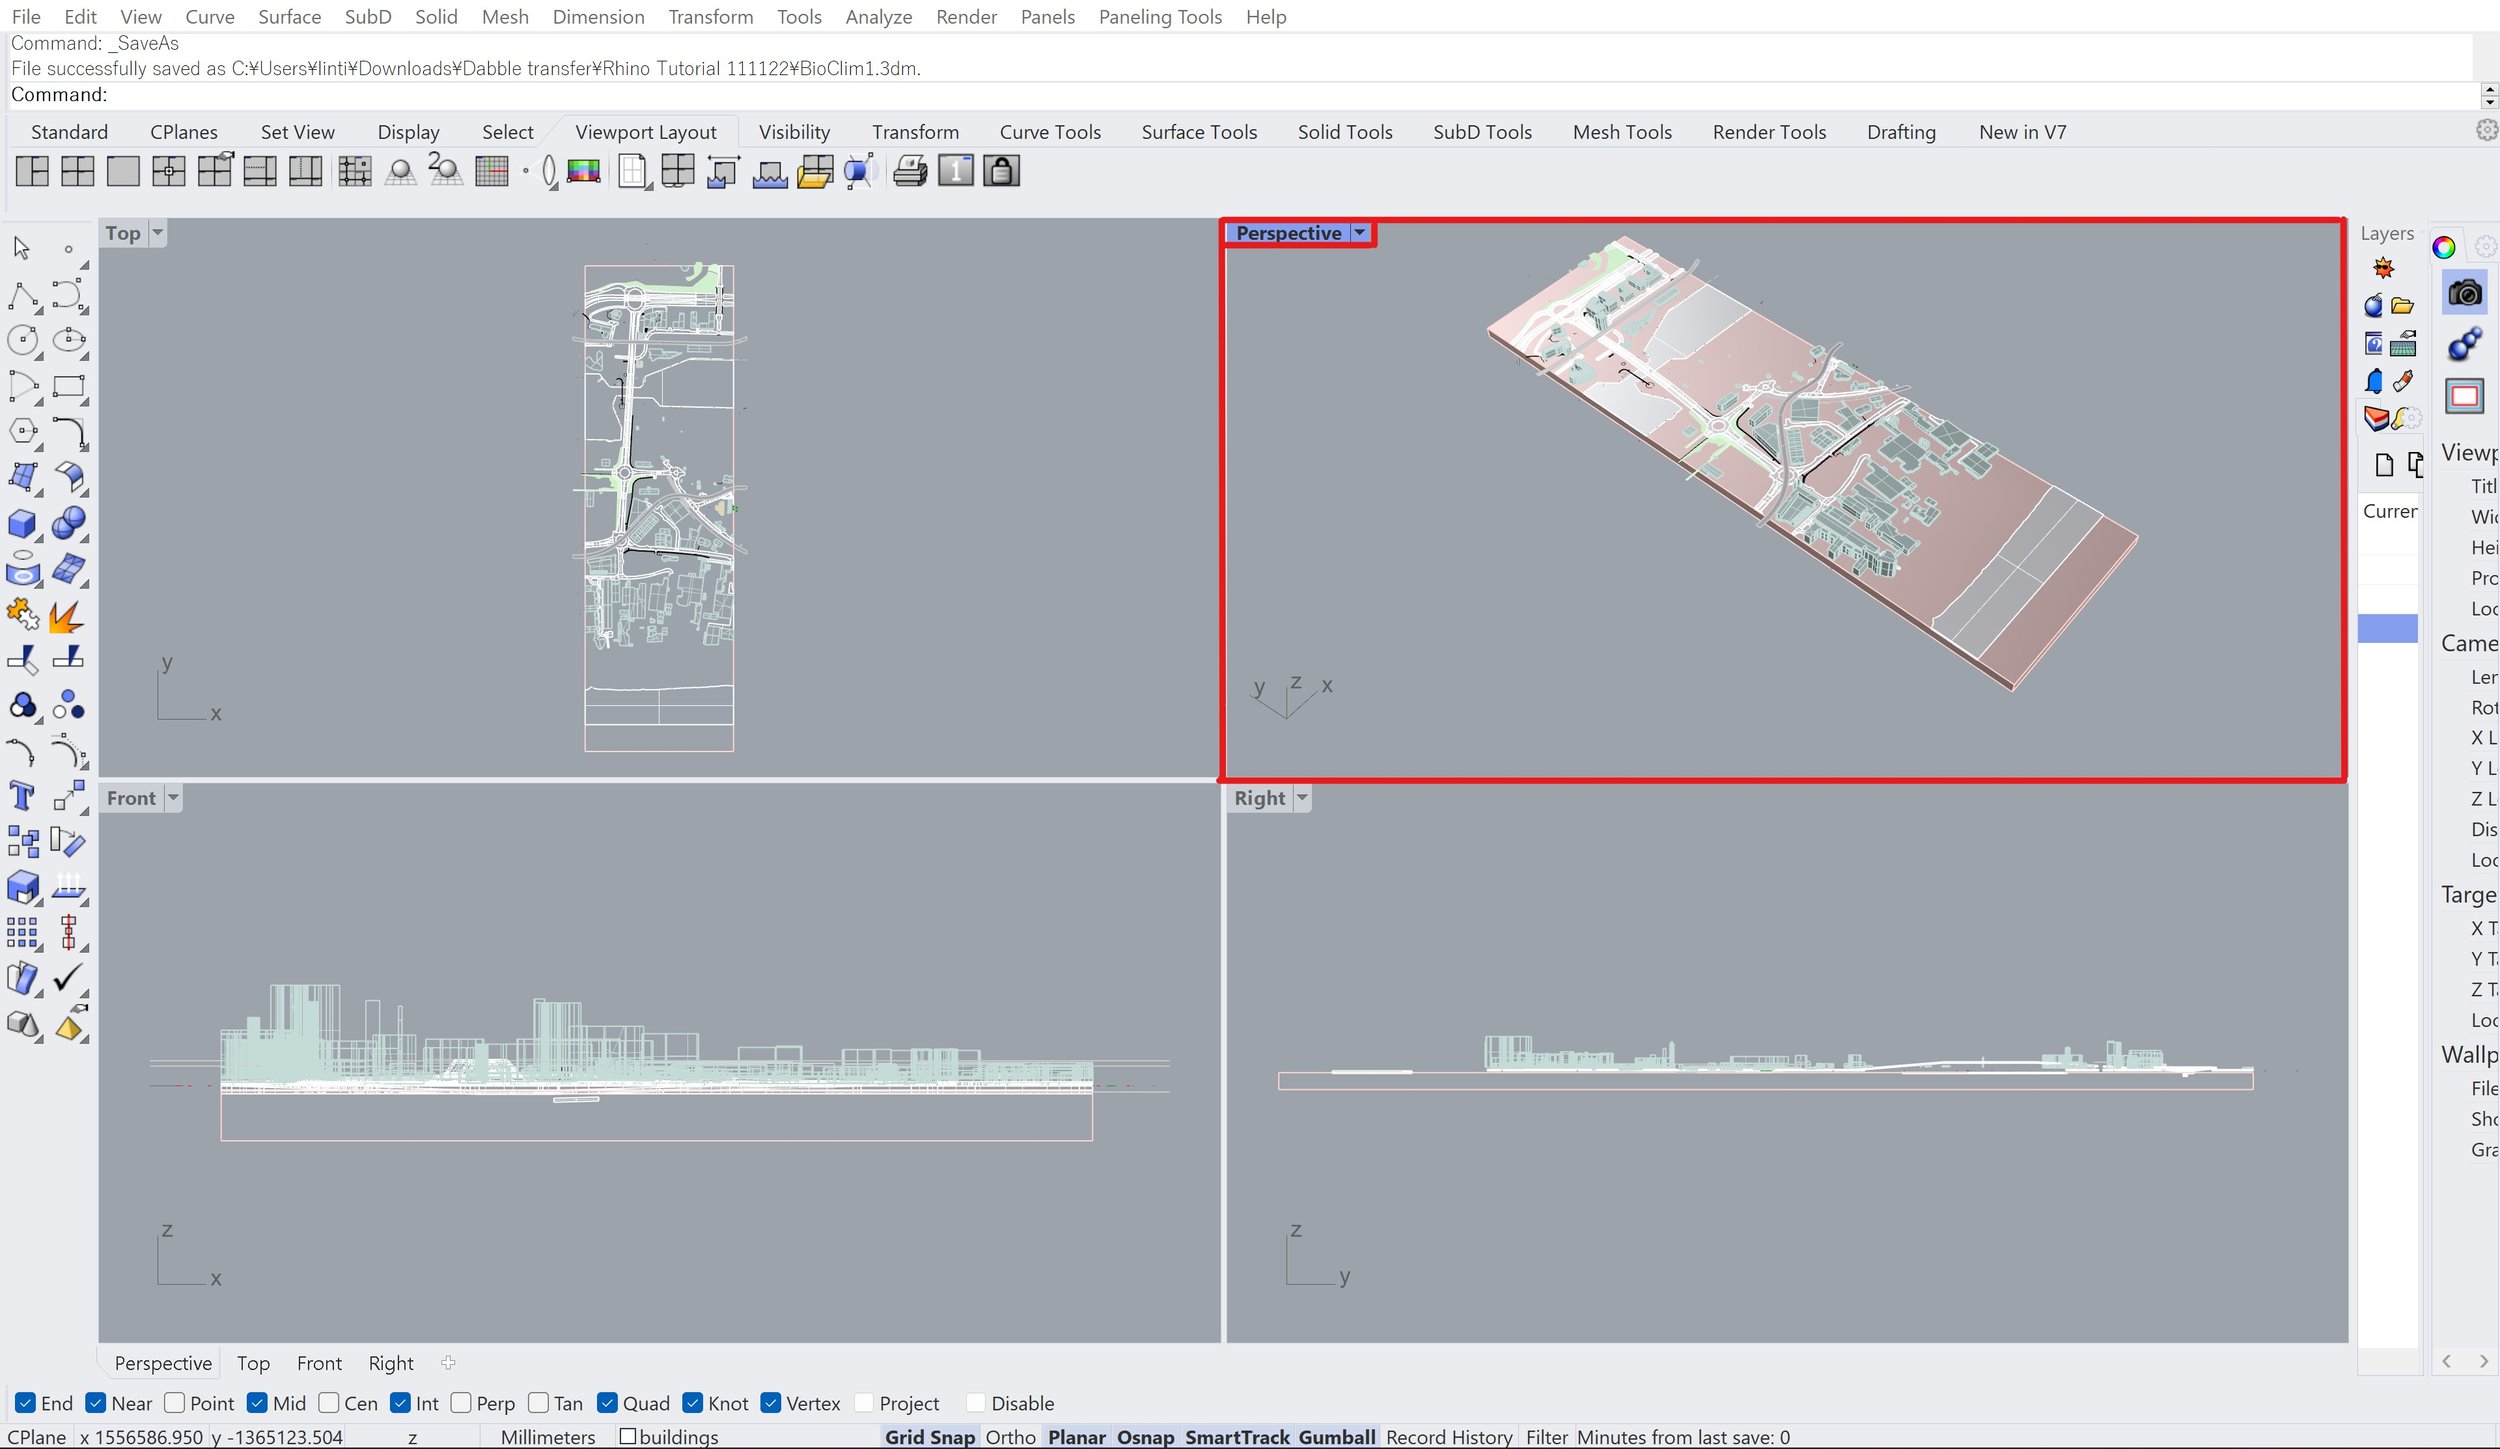
[1] Open up your site model and enlarge the ‘Perspective’ viewport by double-clicking on the tab in the left-hand corner of the window.
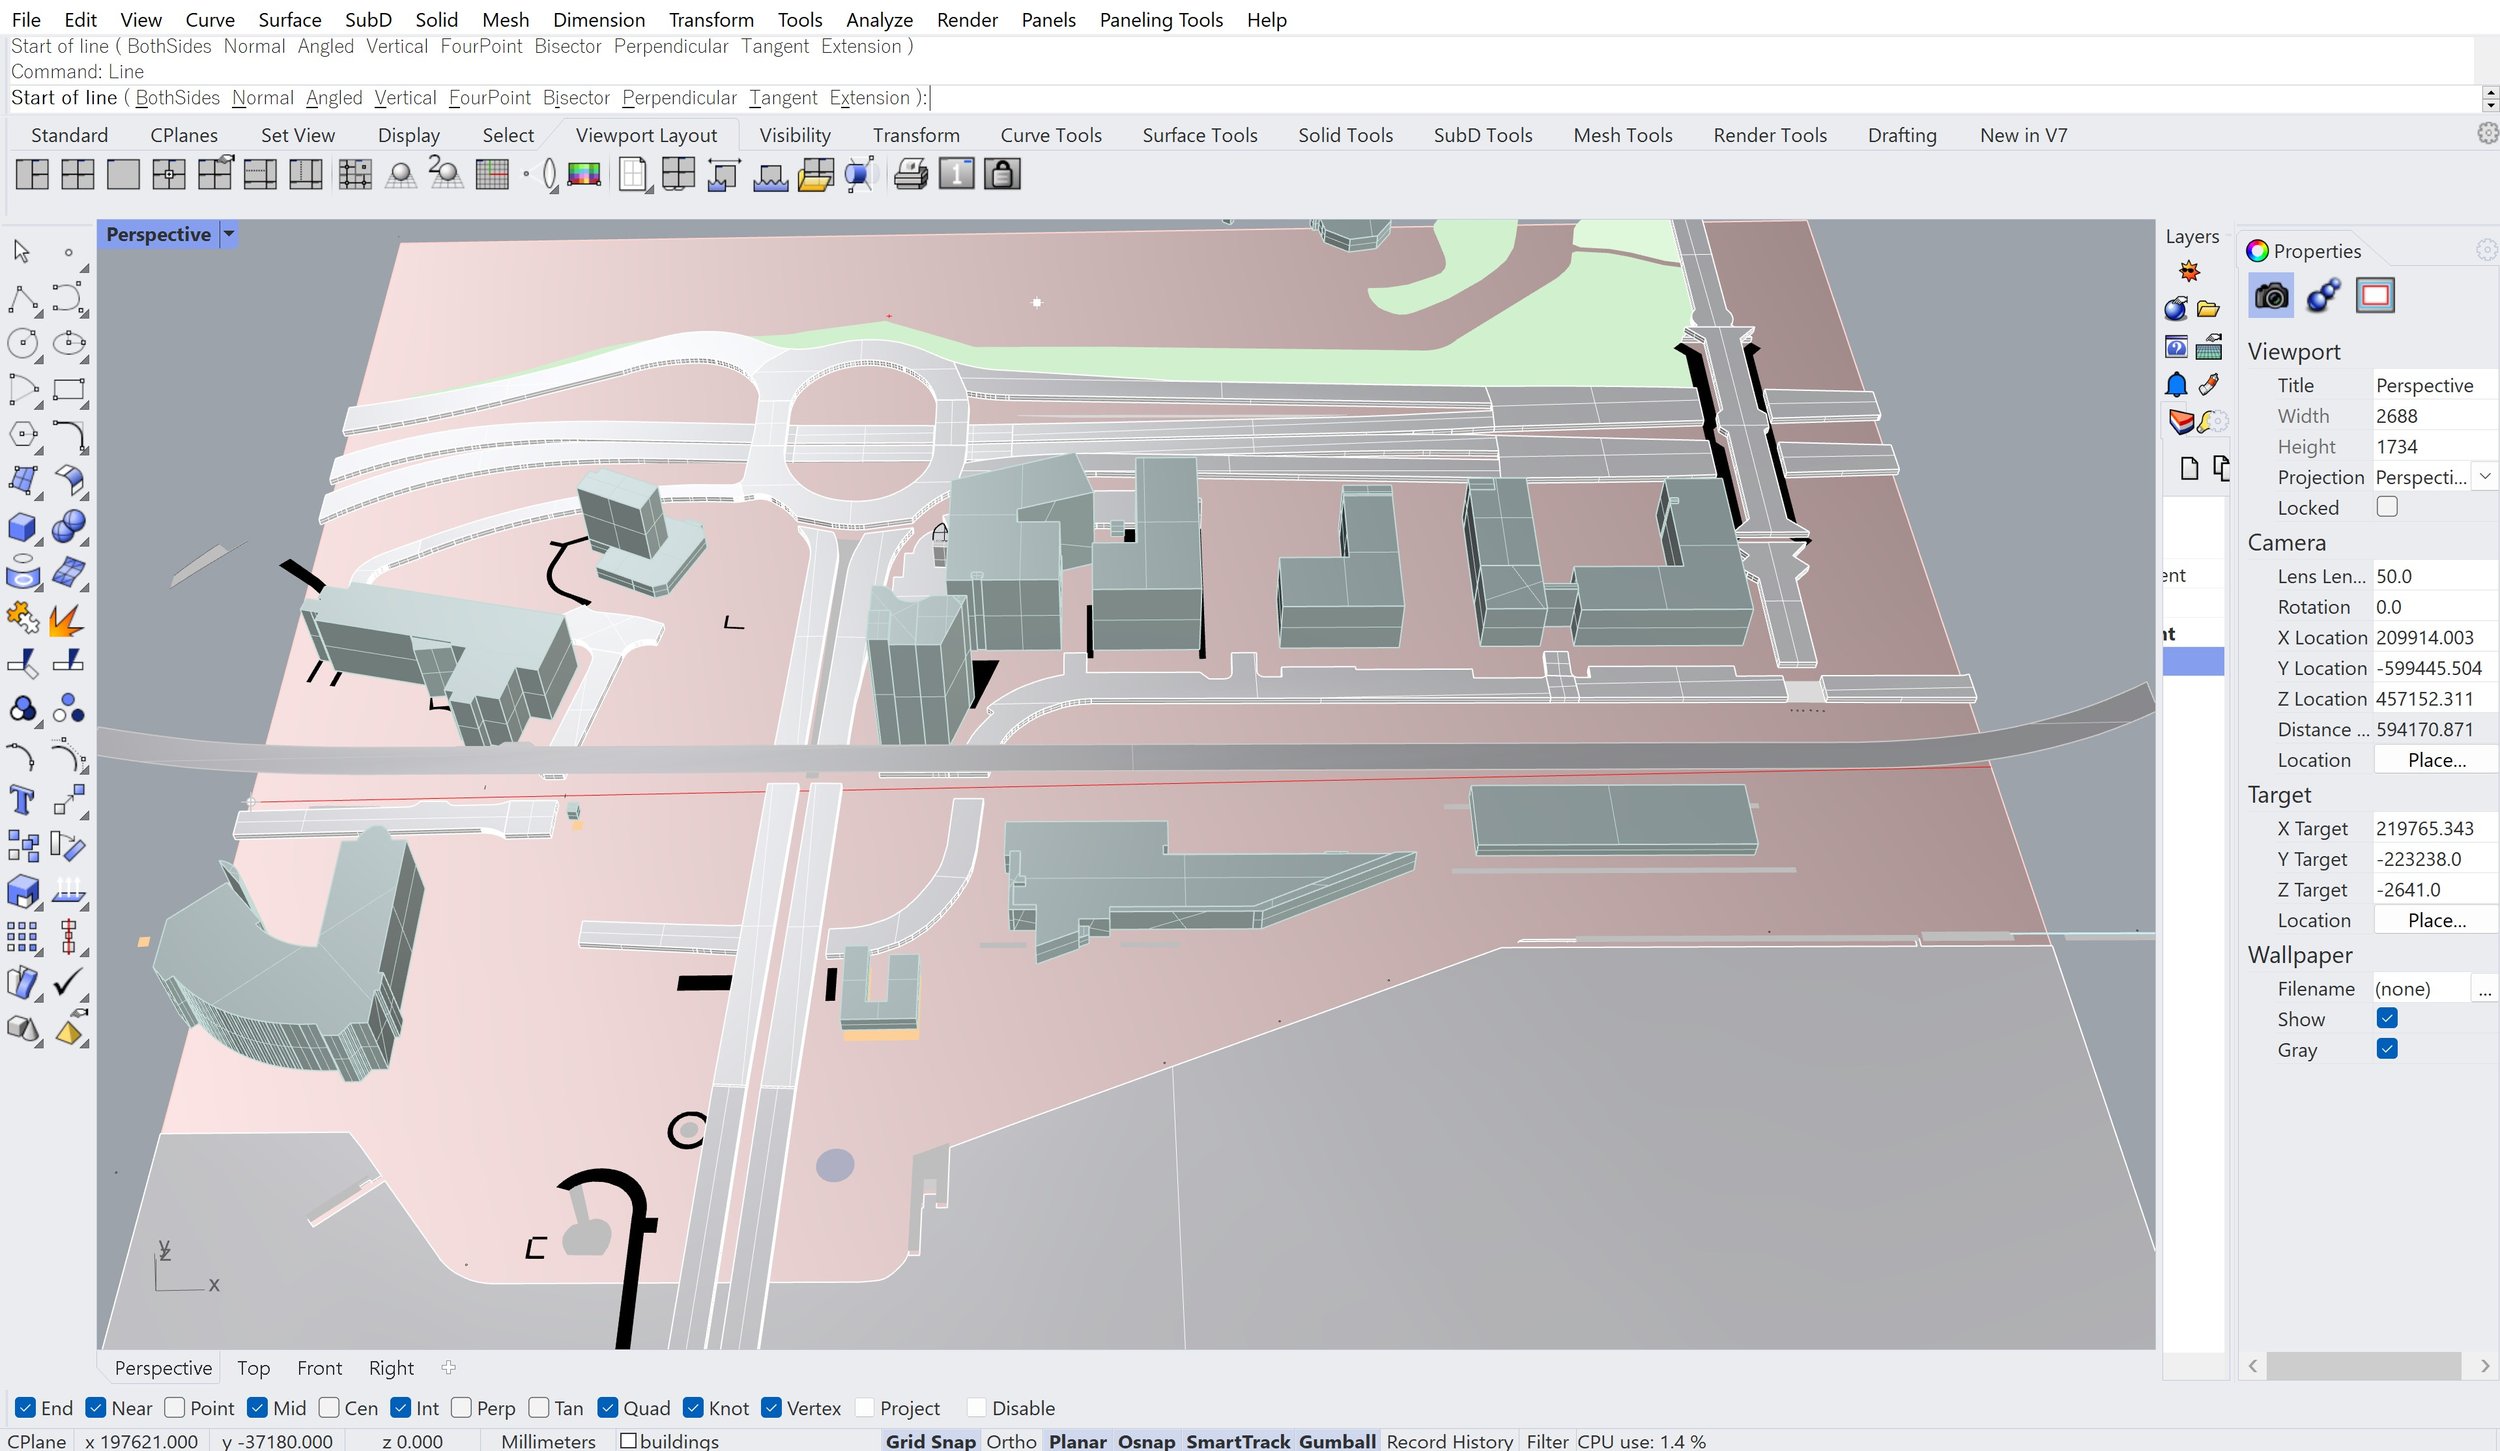
[2] Use the ‘Line’ command to draw the cut line you want in your section. Choose either a north-facing or south-facing section so you can effectively show the sun paths later on.
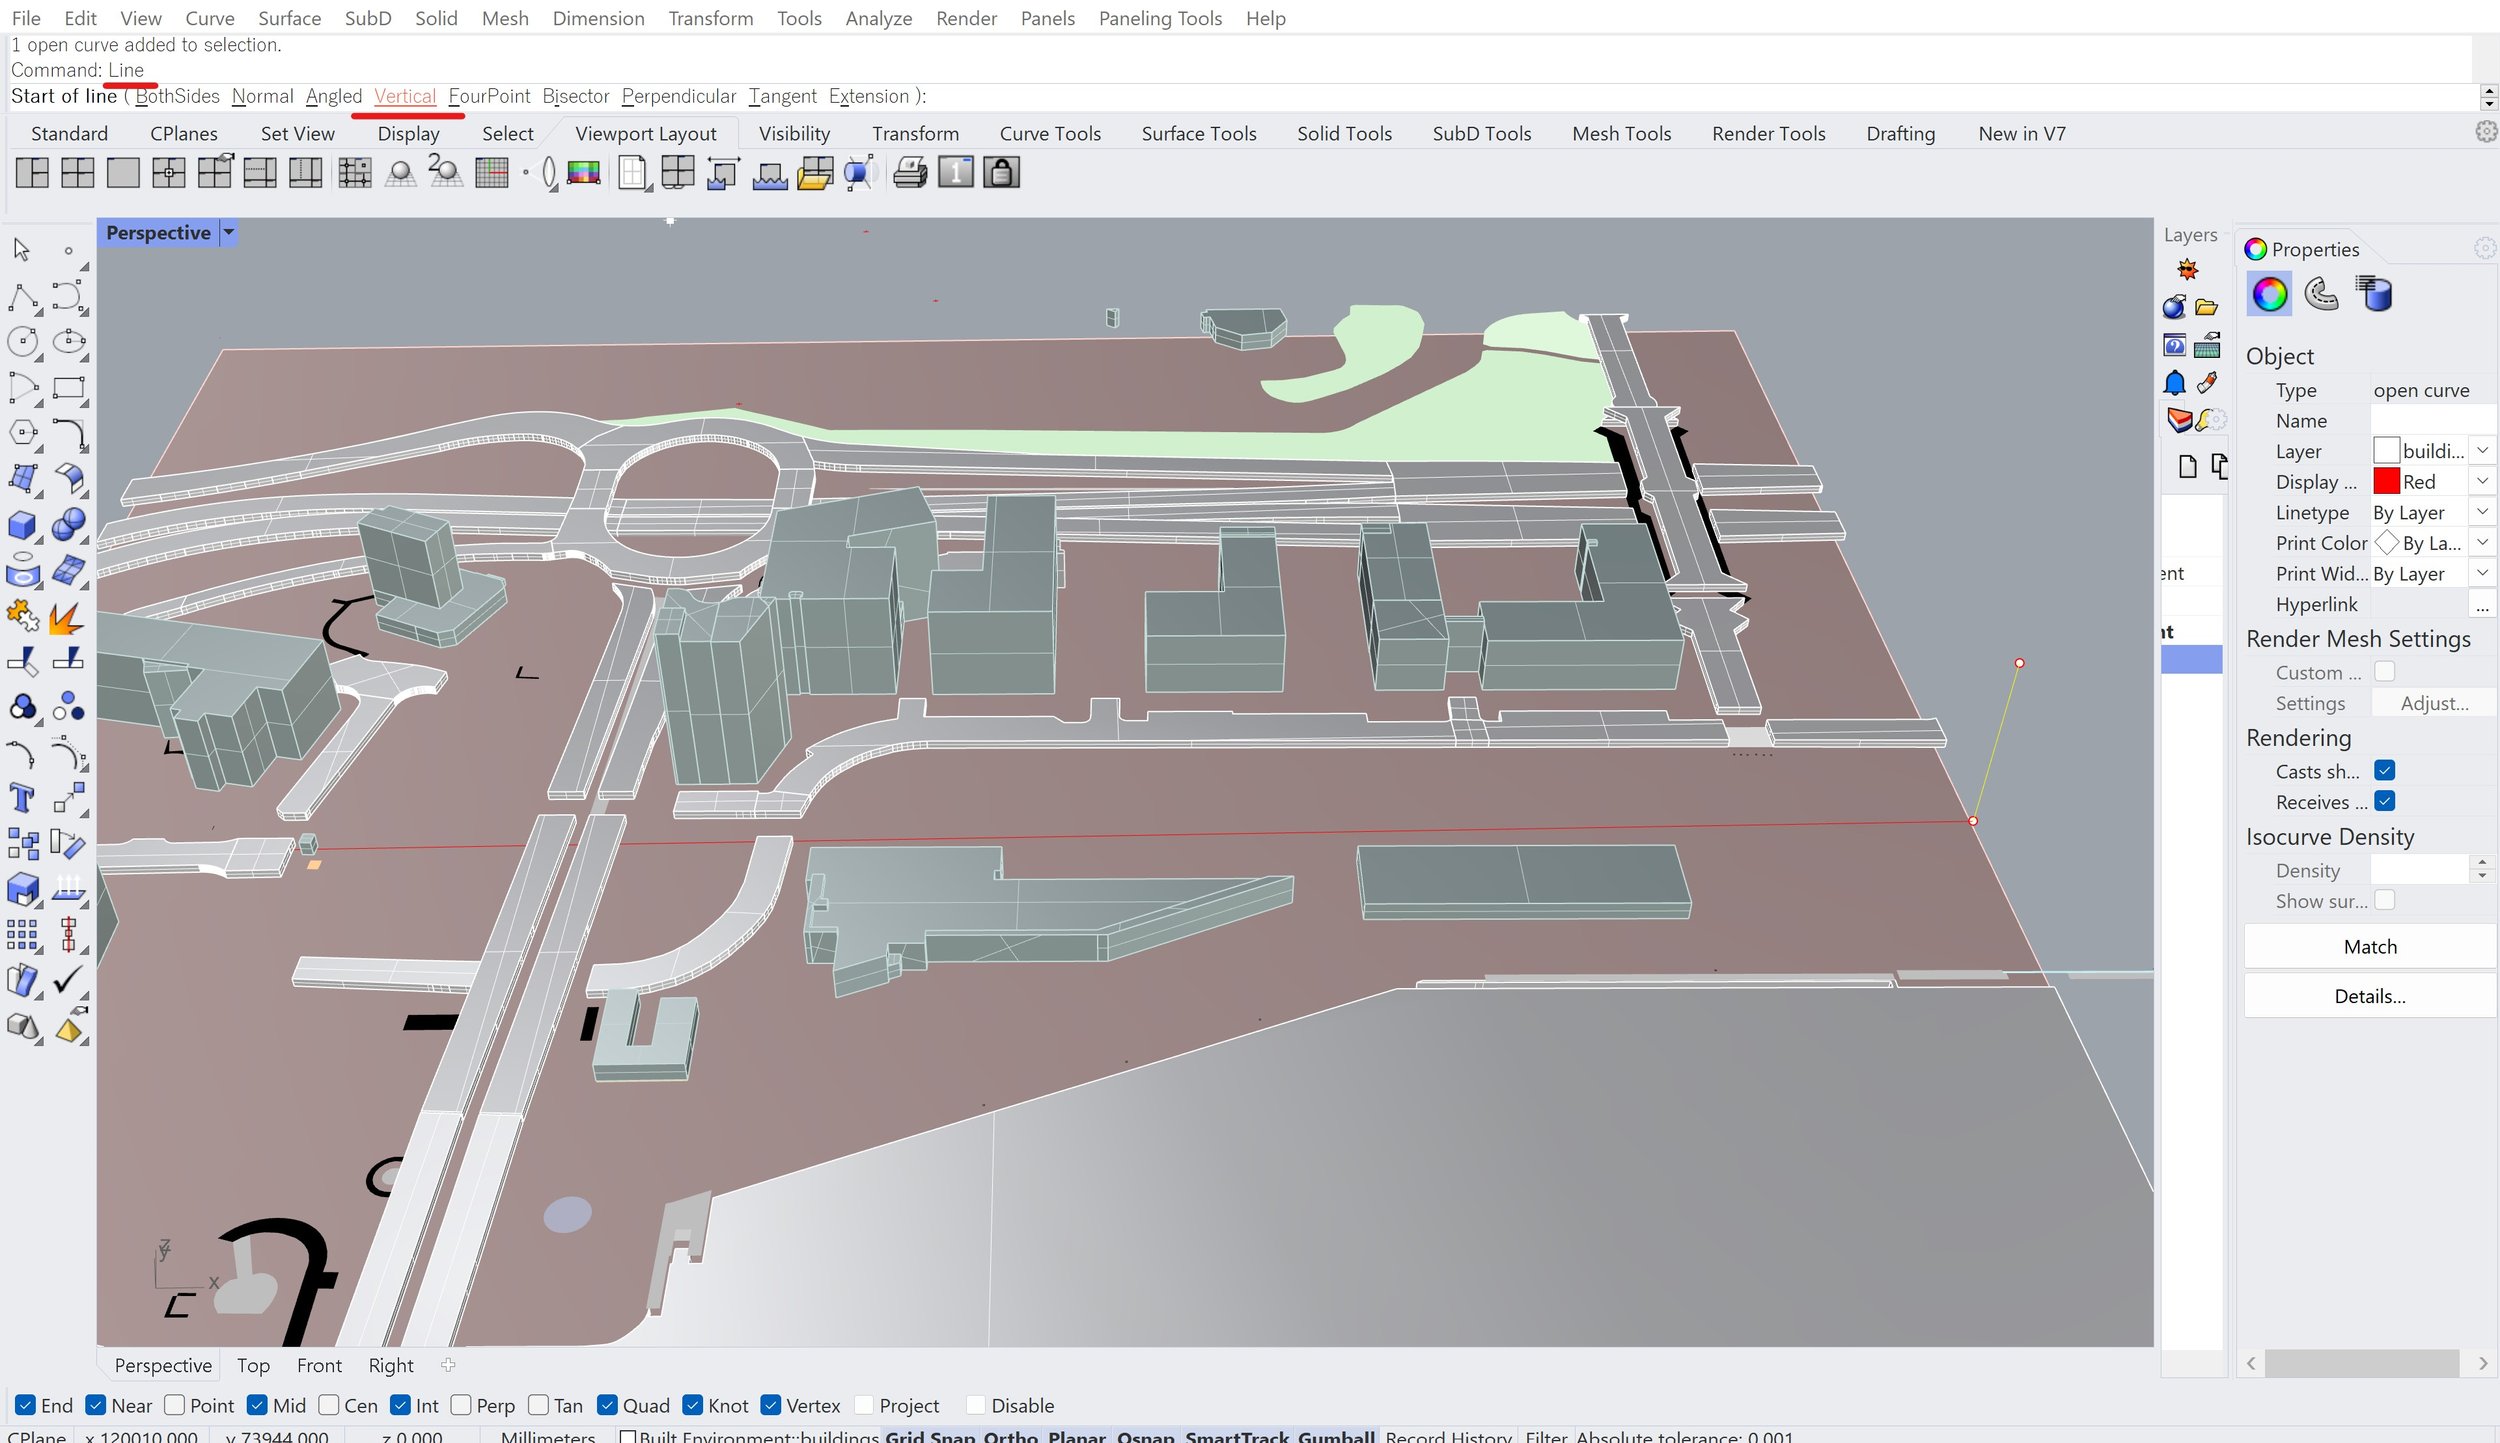
[3] At one end of the line, use the ‘Line’ command again, enter ‘V’ or click ‘Vertical’ and draw a short vertical line upwards from this point.
[4] Type in ‘ClippingPlane’ in the command bar at the top of your workspace, and draw your clipping plane from the top of the vertical line you’ve drawn. The dimensions don’t really matter, but rather the location of the plane which we’ll be amending.

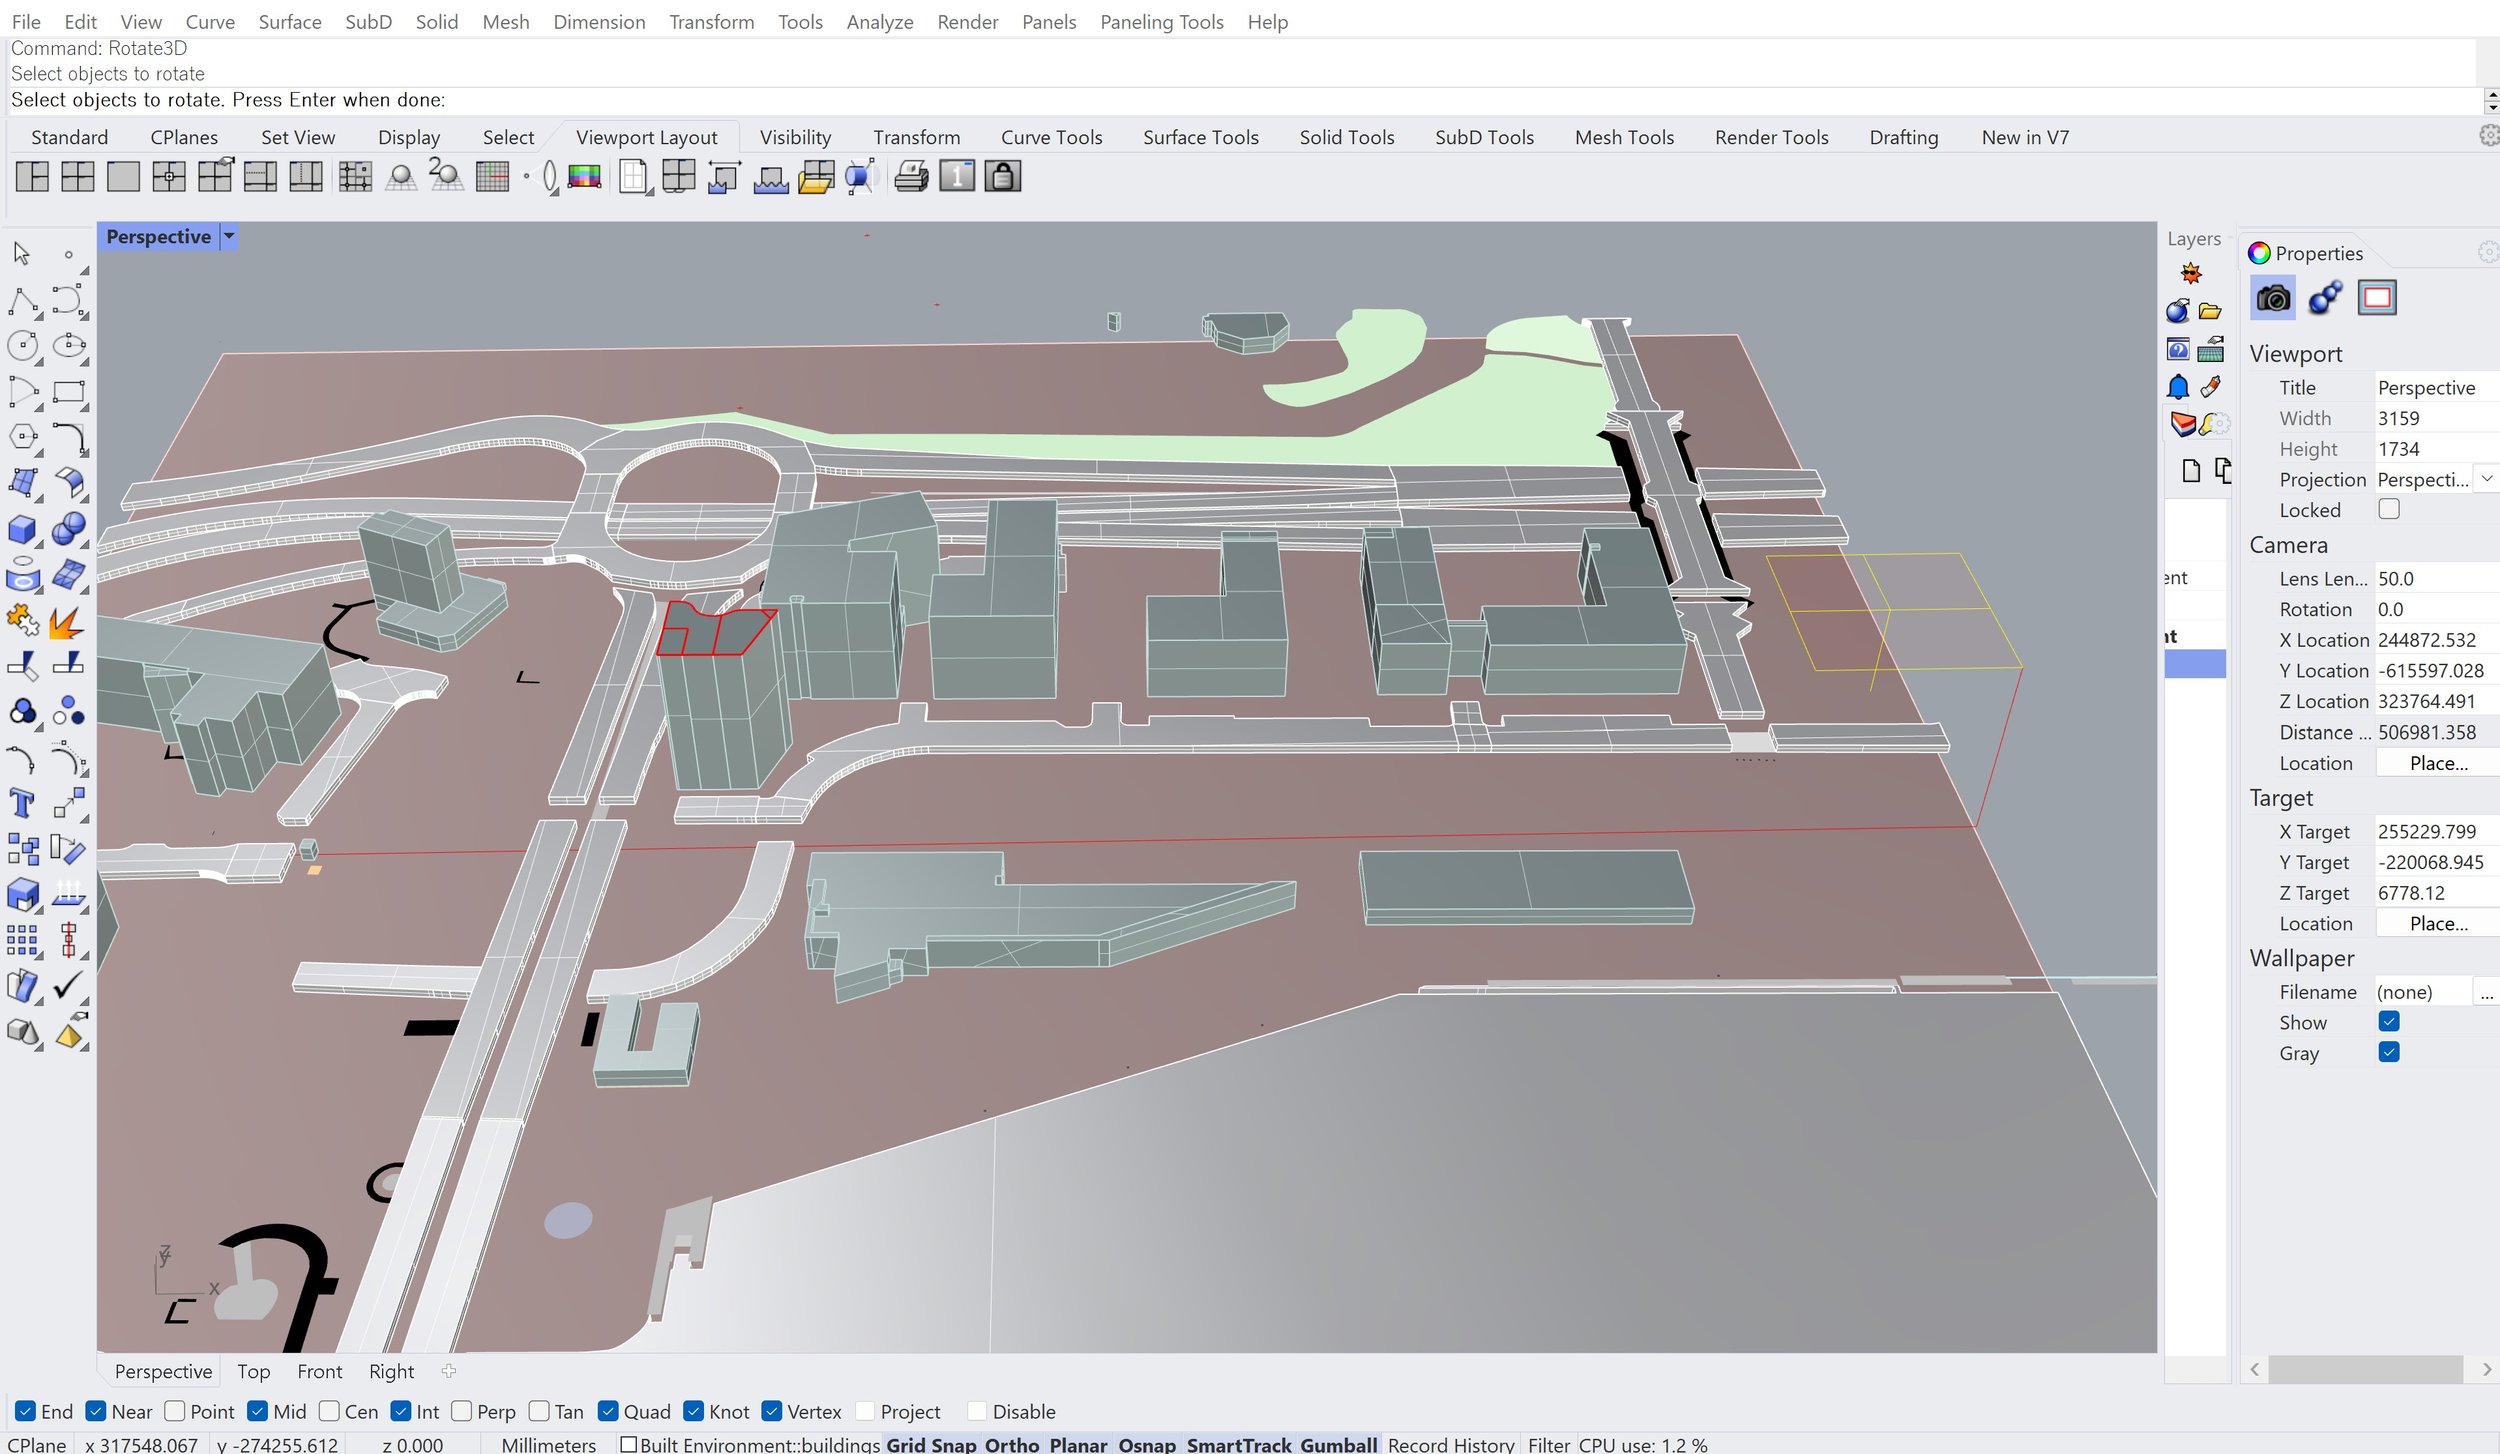
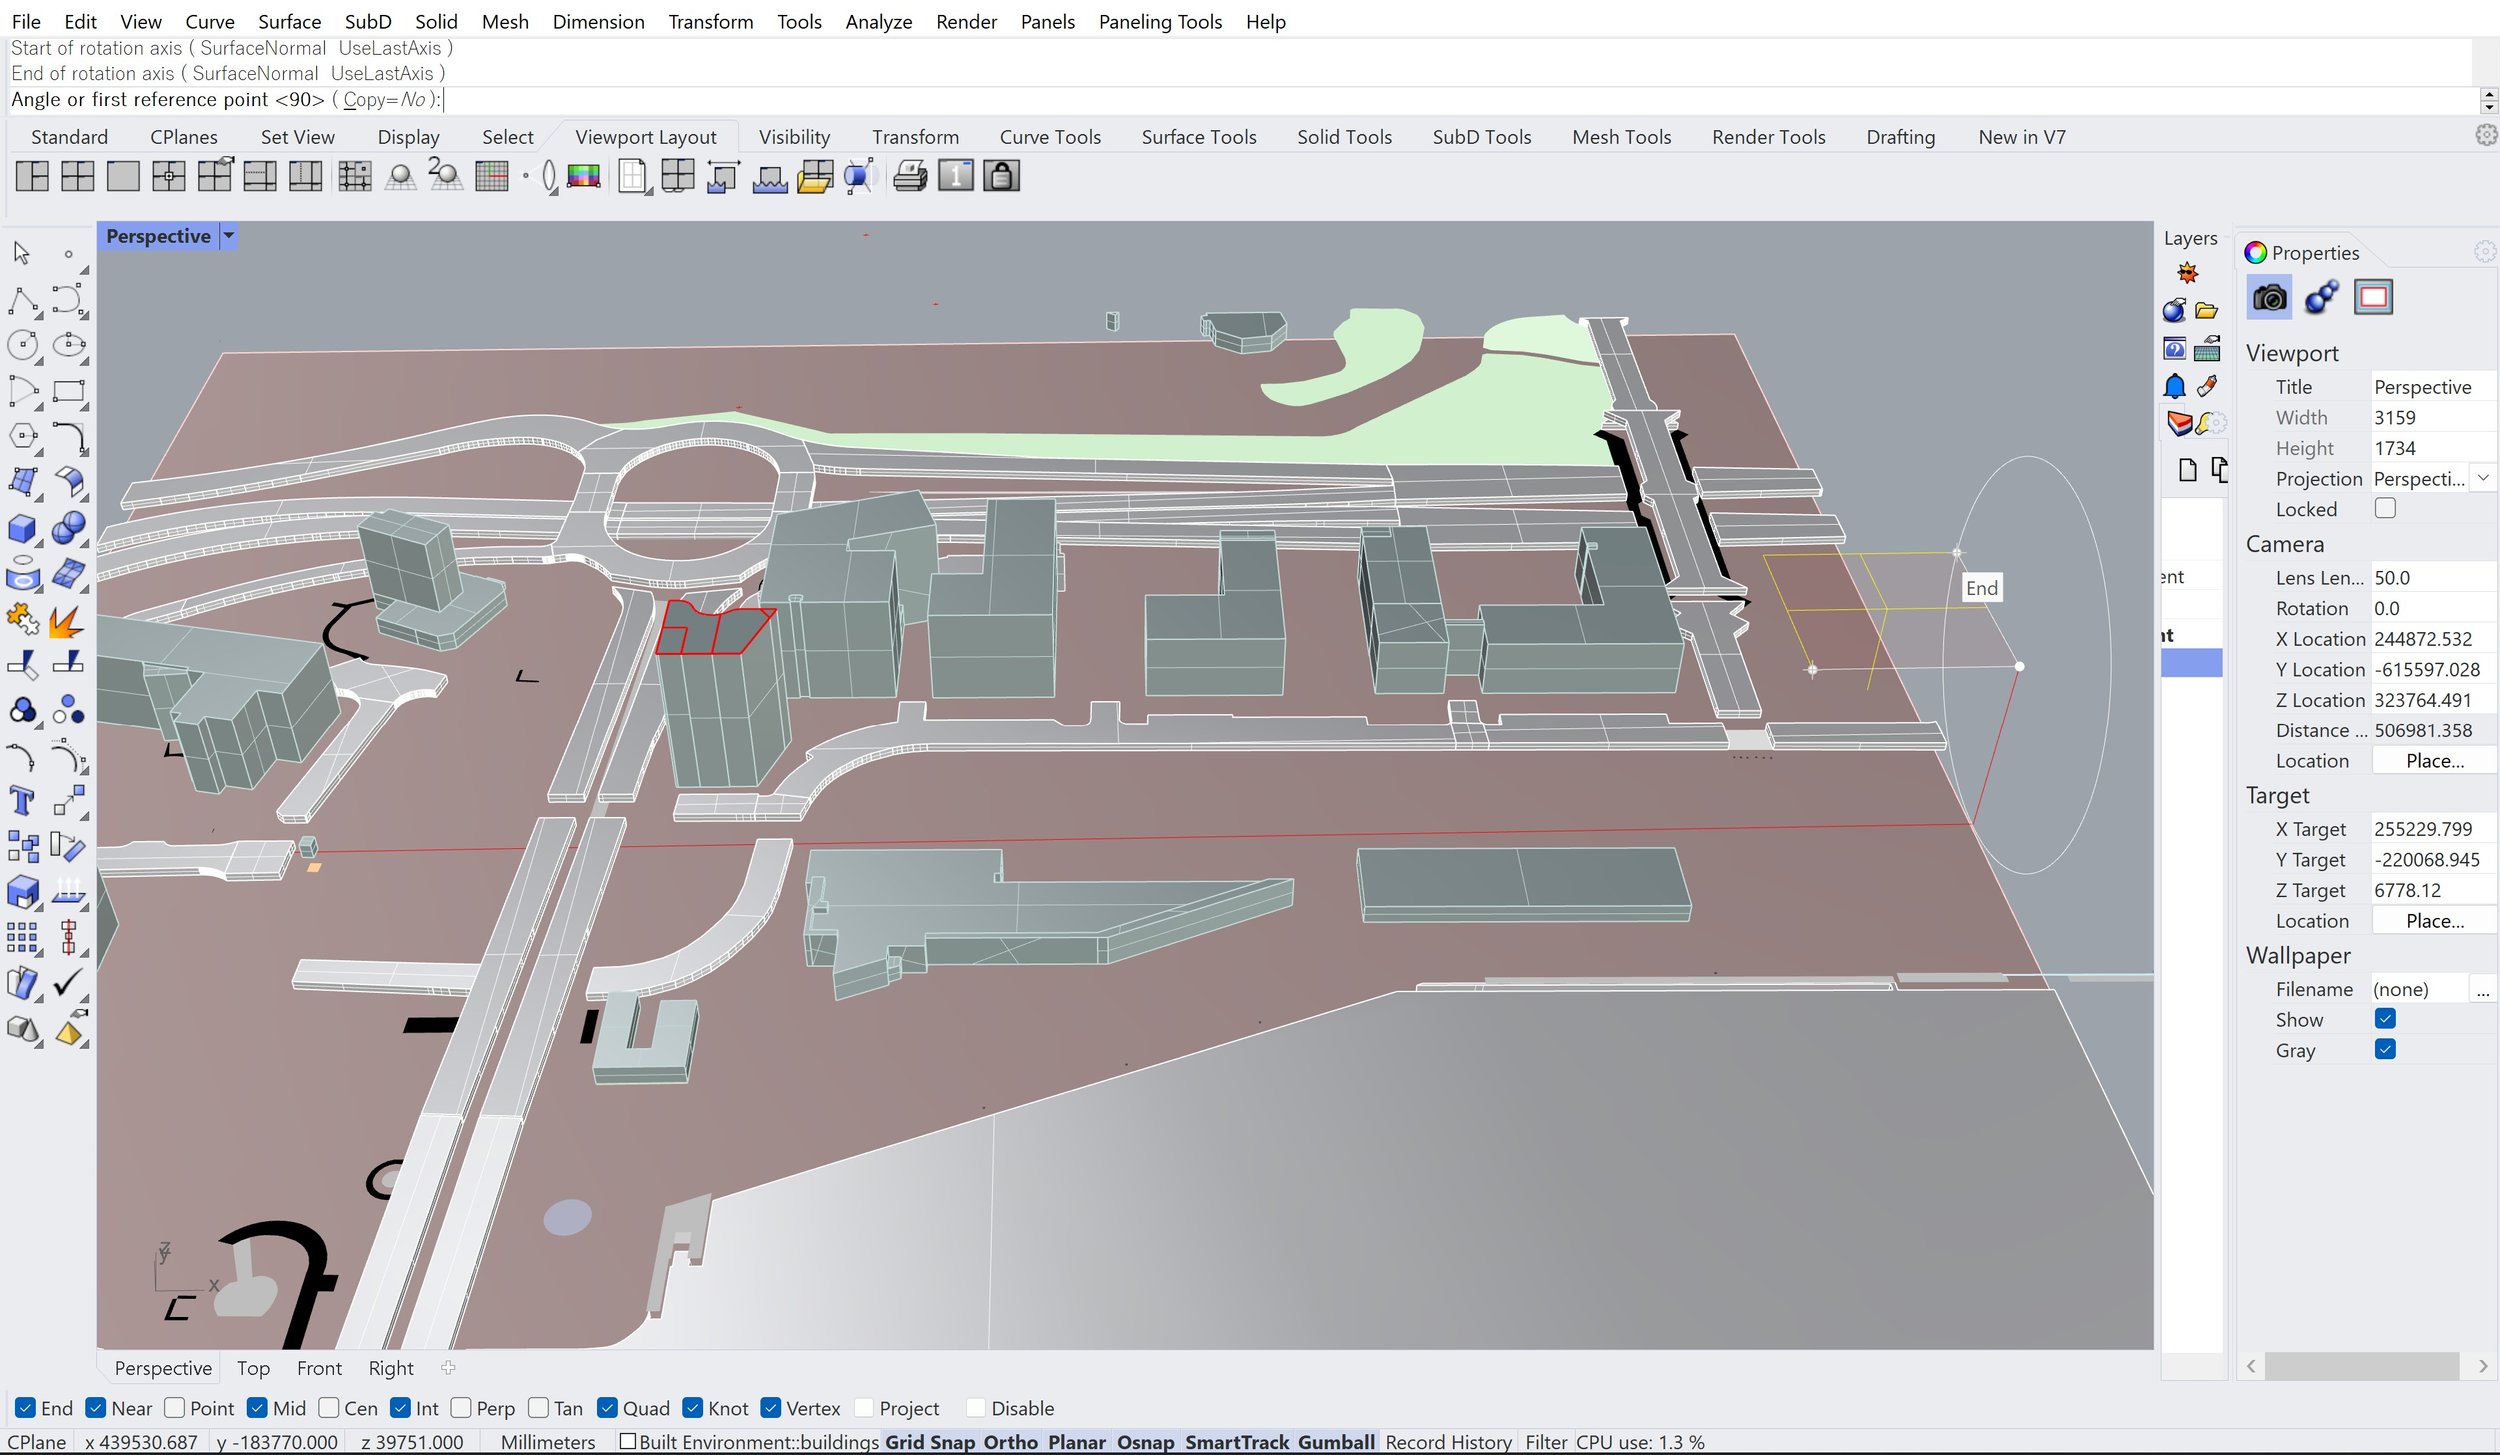
[5] Type ‘Rotate3D’ into the command bar, and follow these steps:
[6] Select the clipping plane as the object to rotate
[7] Select the corner where the clipping plane and vertical line meet as the start of the rotation axis
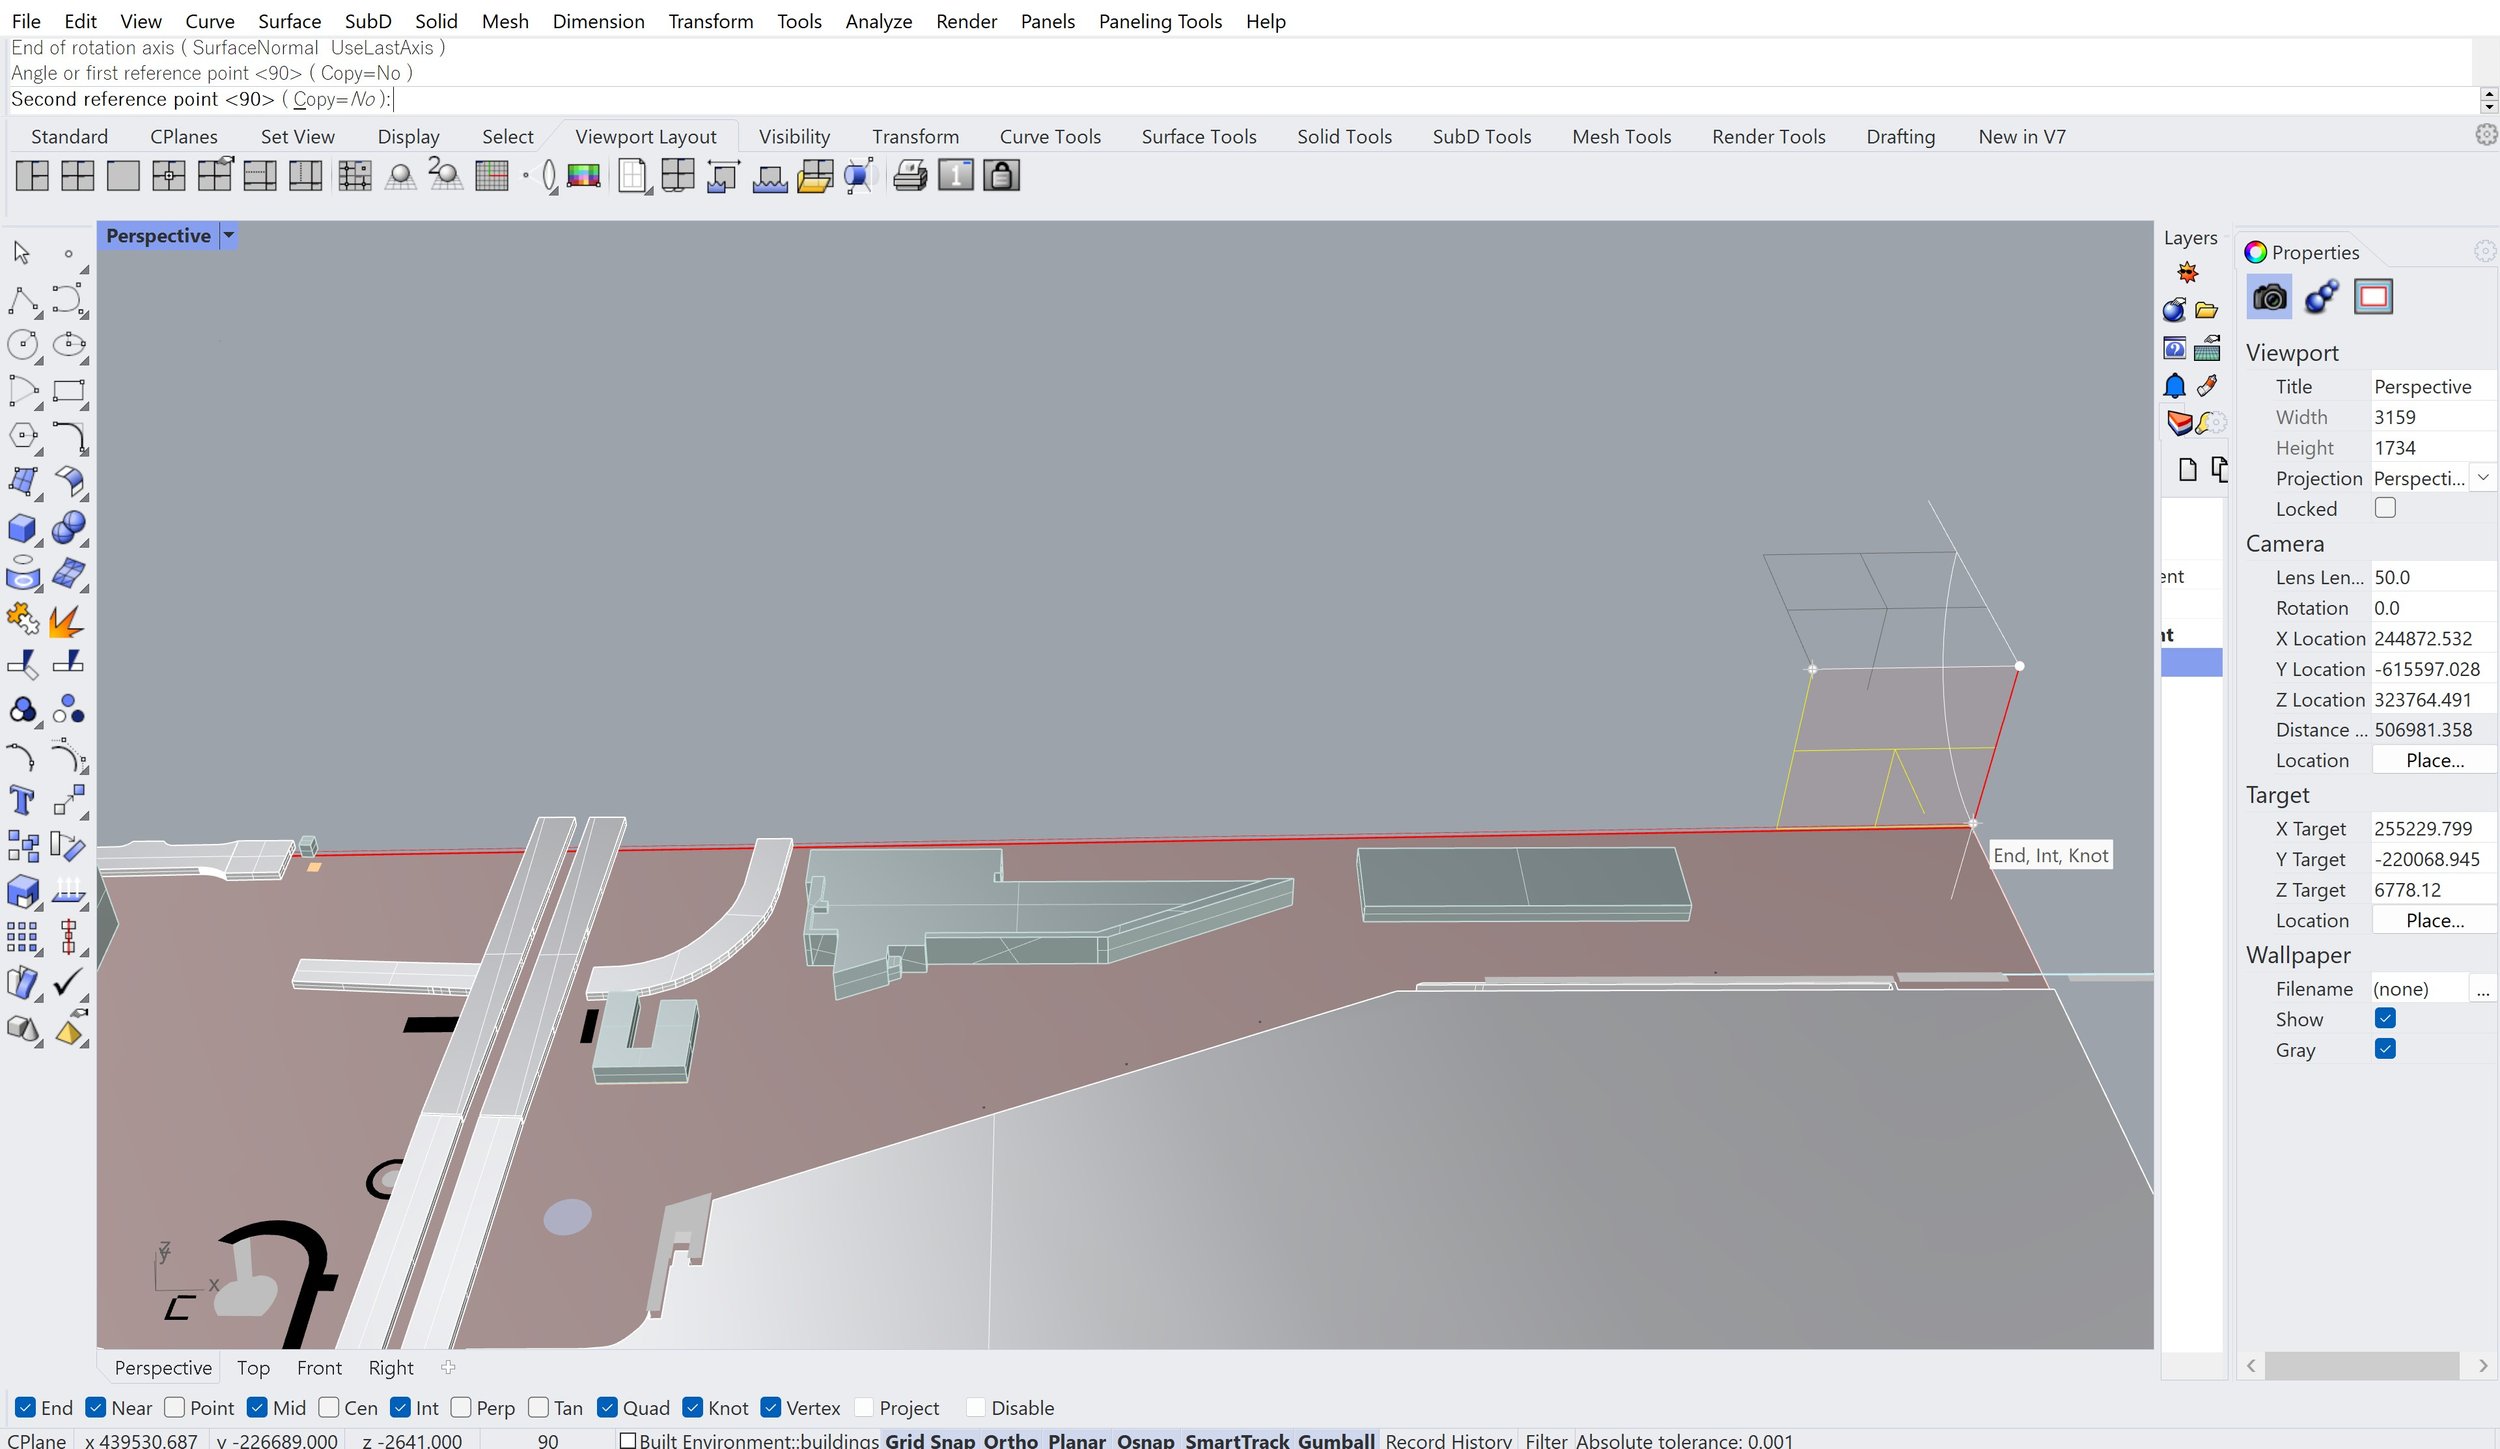
[8] Select the opposite end of the clipping plane that goes along the cut line as the end of the rotation axis
[9] Select the other corner that projects from where the clipping plane and vertical line meet as the angle or first reference point
[10] Select the bottom of the vertical line as the second reference point.
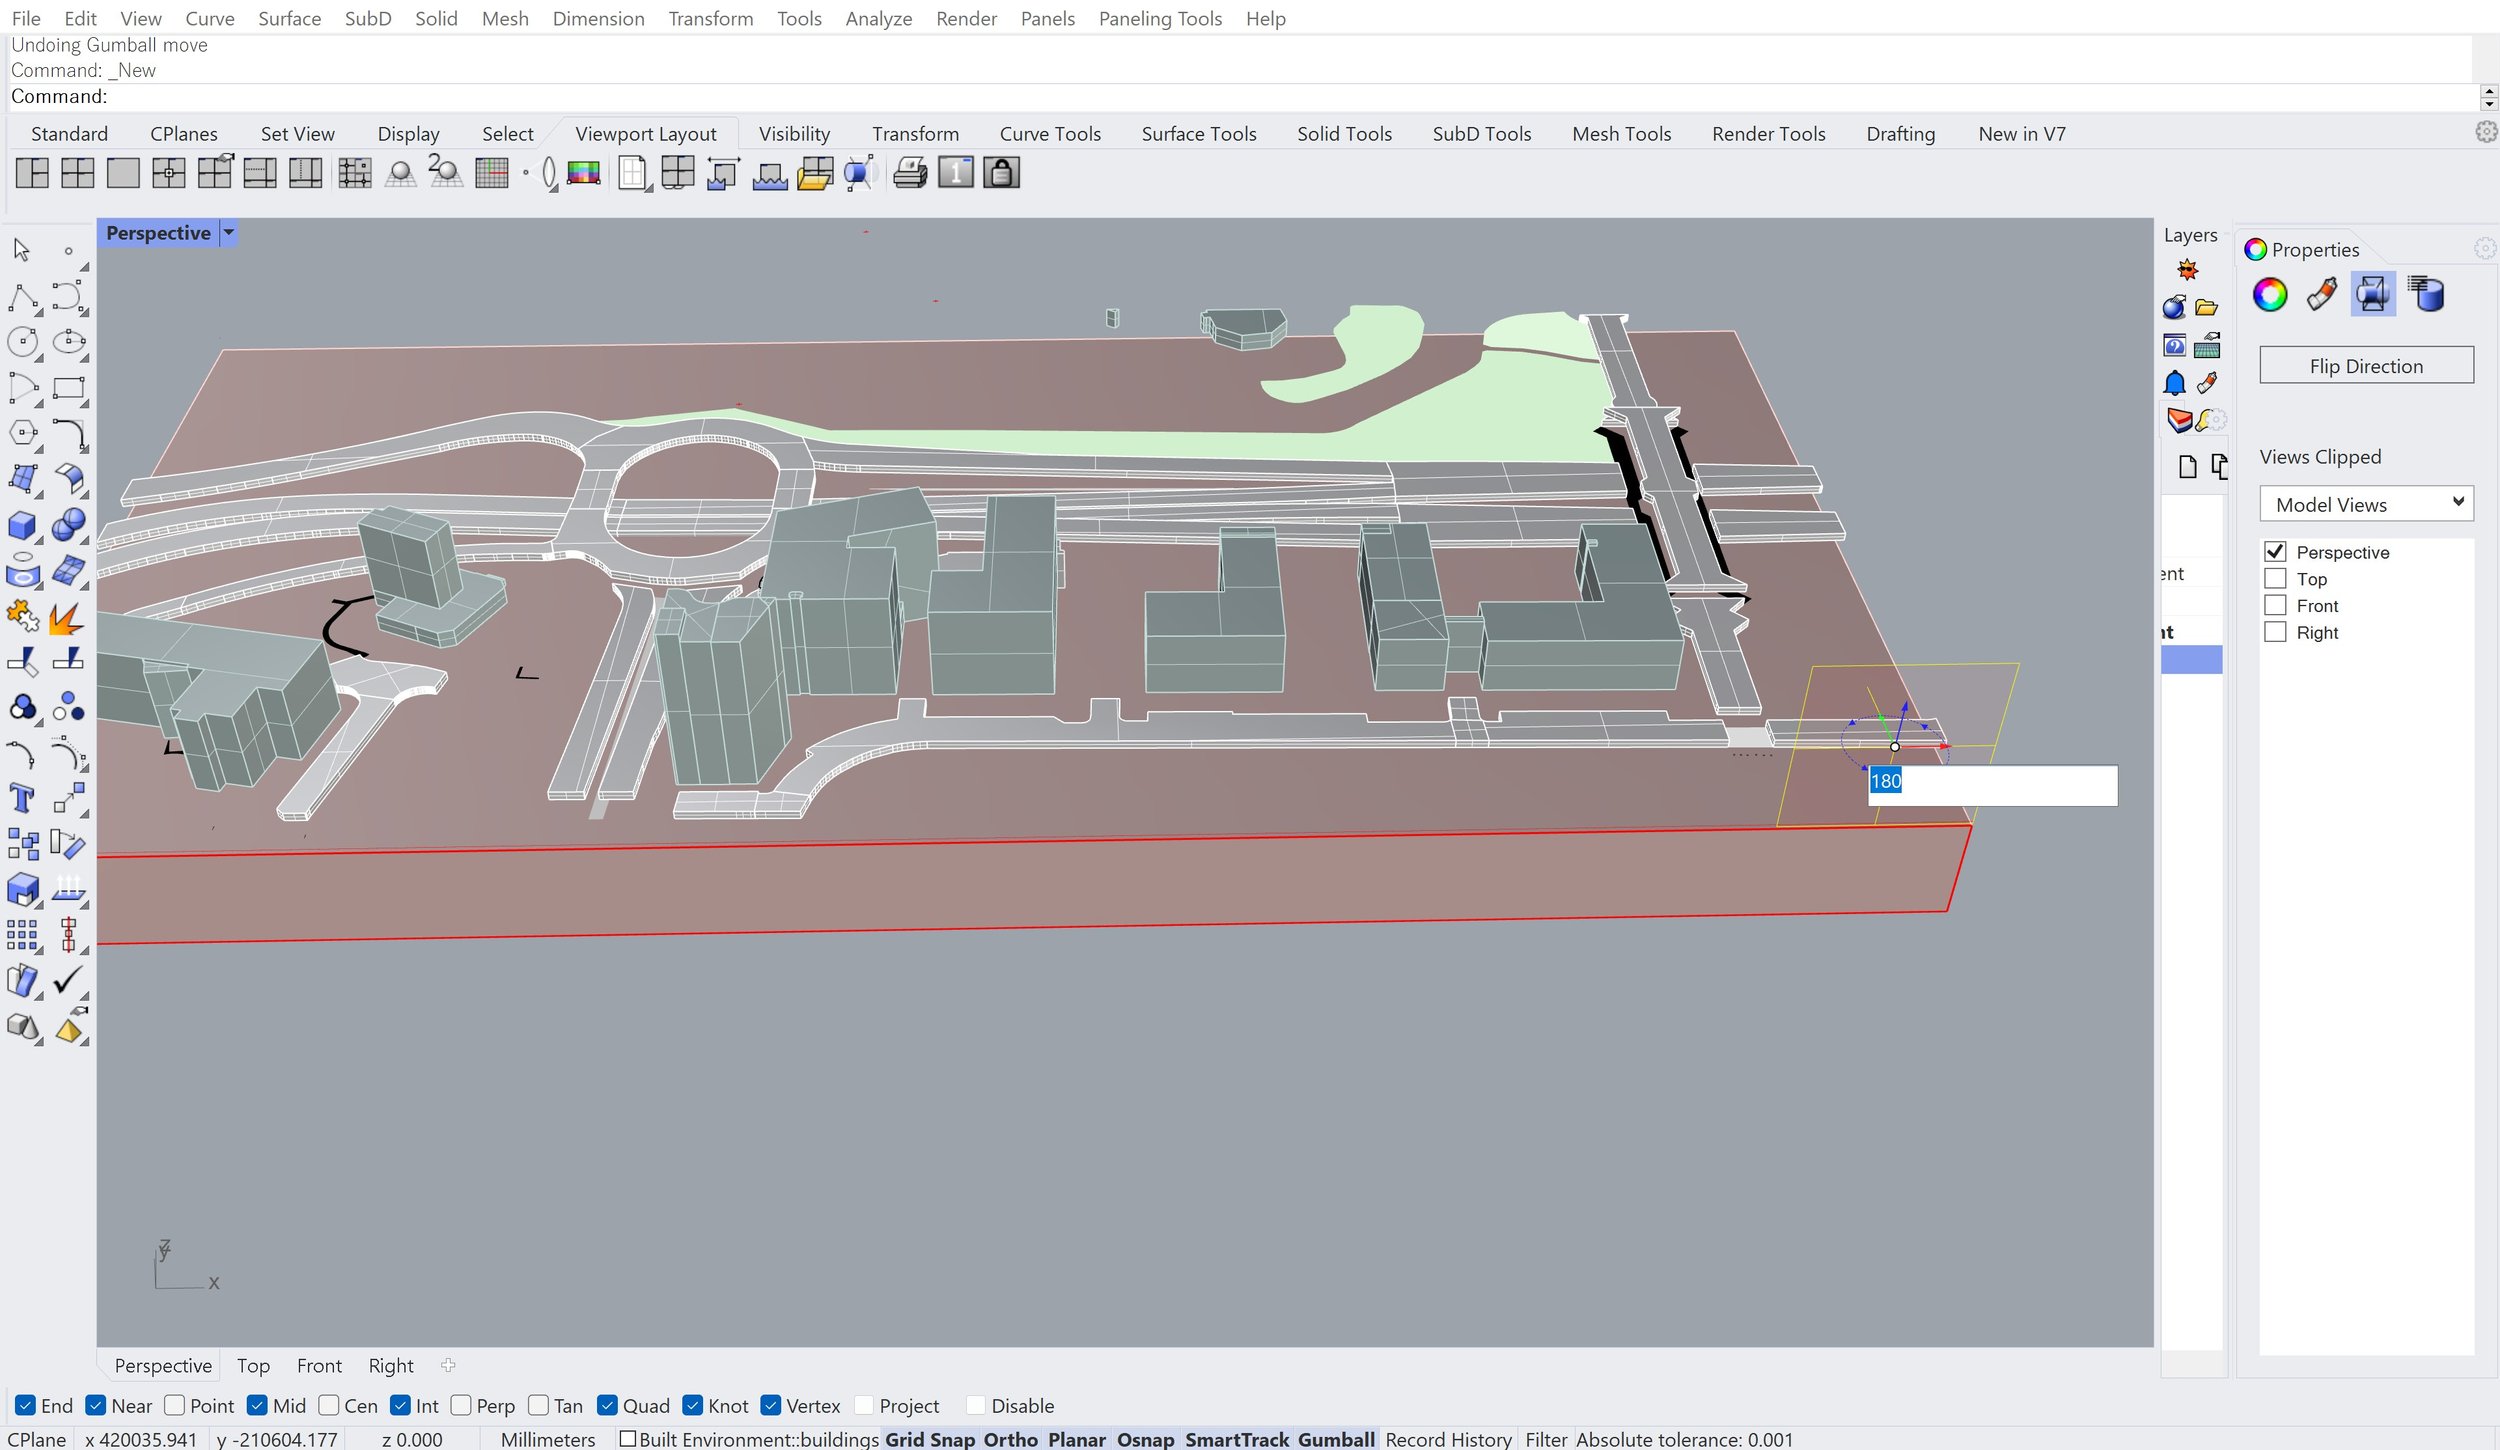
This should now have set the clipping plane along the cut line to give you a section cut. If it’s cutting the wrong side of the model, simply rotate it 180 degrees about the cut line by clicking on the blue curve of the gumball.


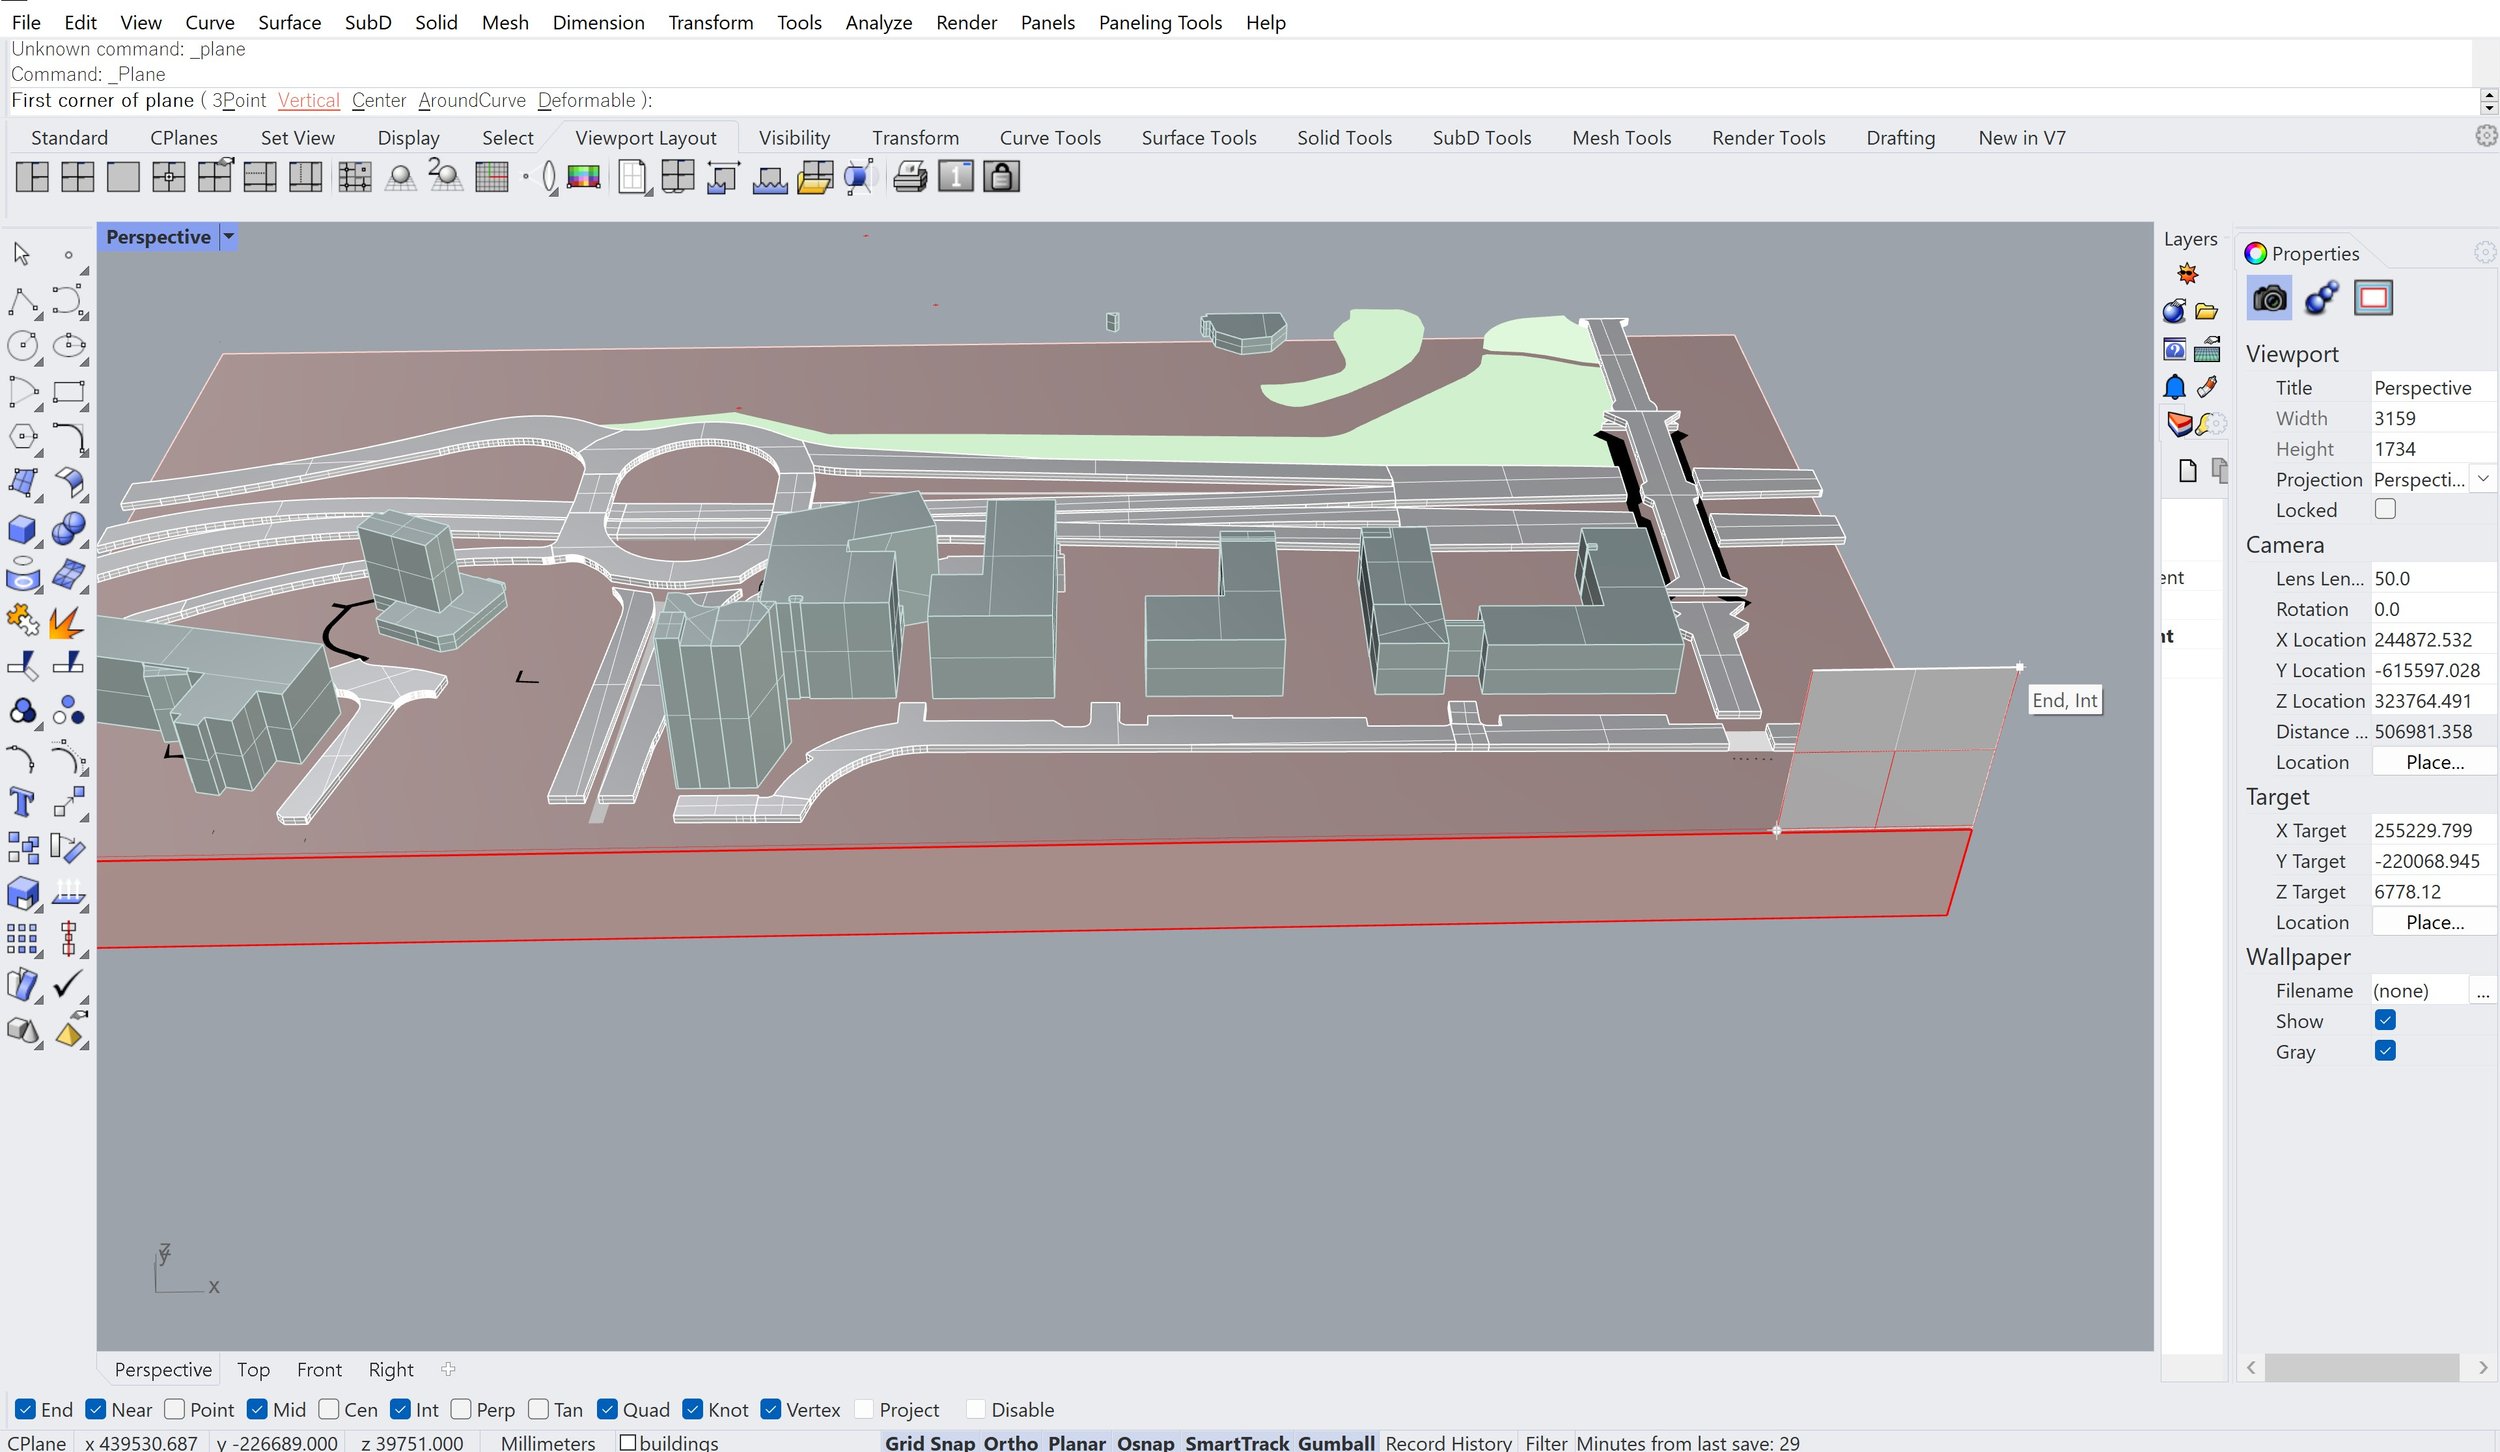
Now, we’re going to align the camera to the cut line so the section is taken from the correct angle.
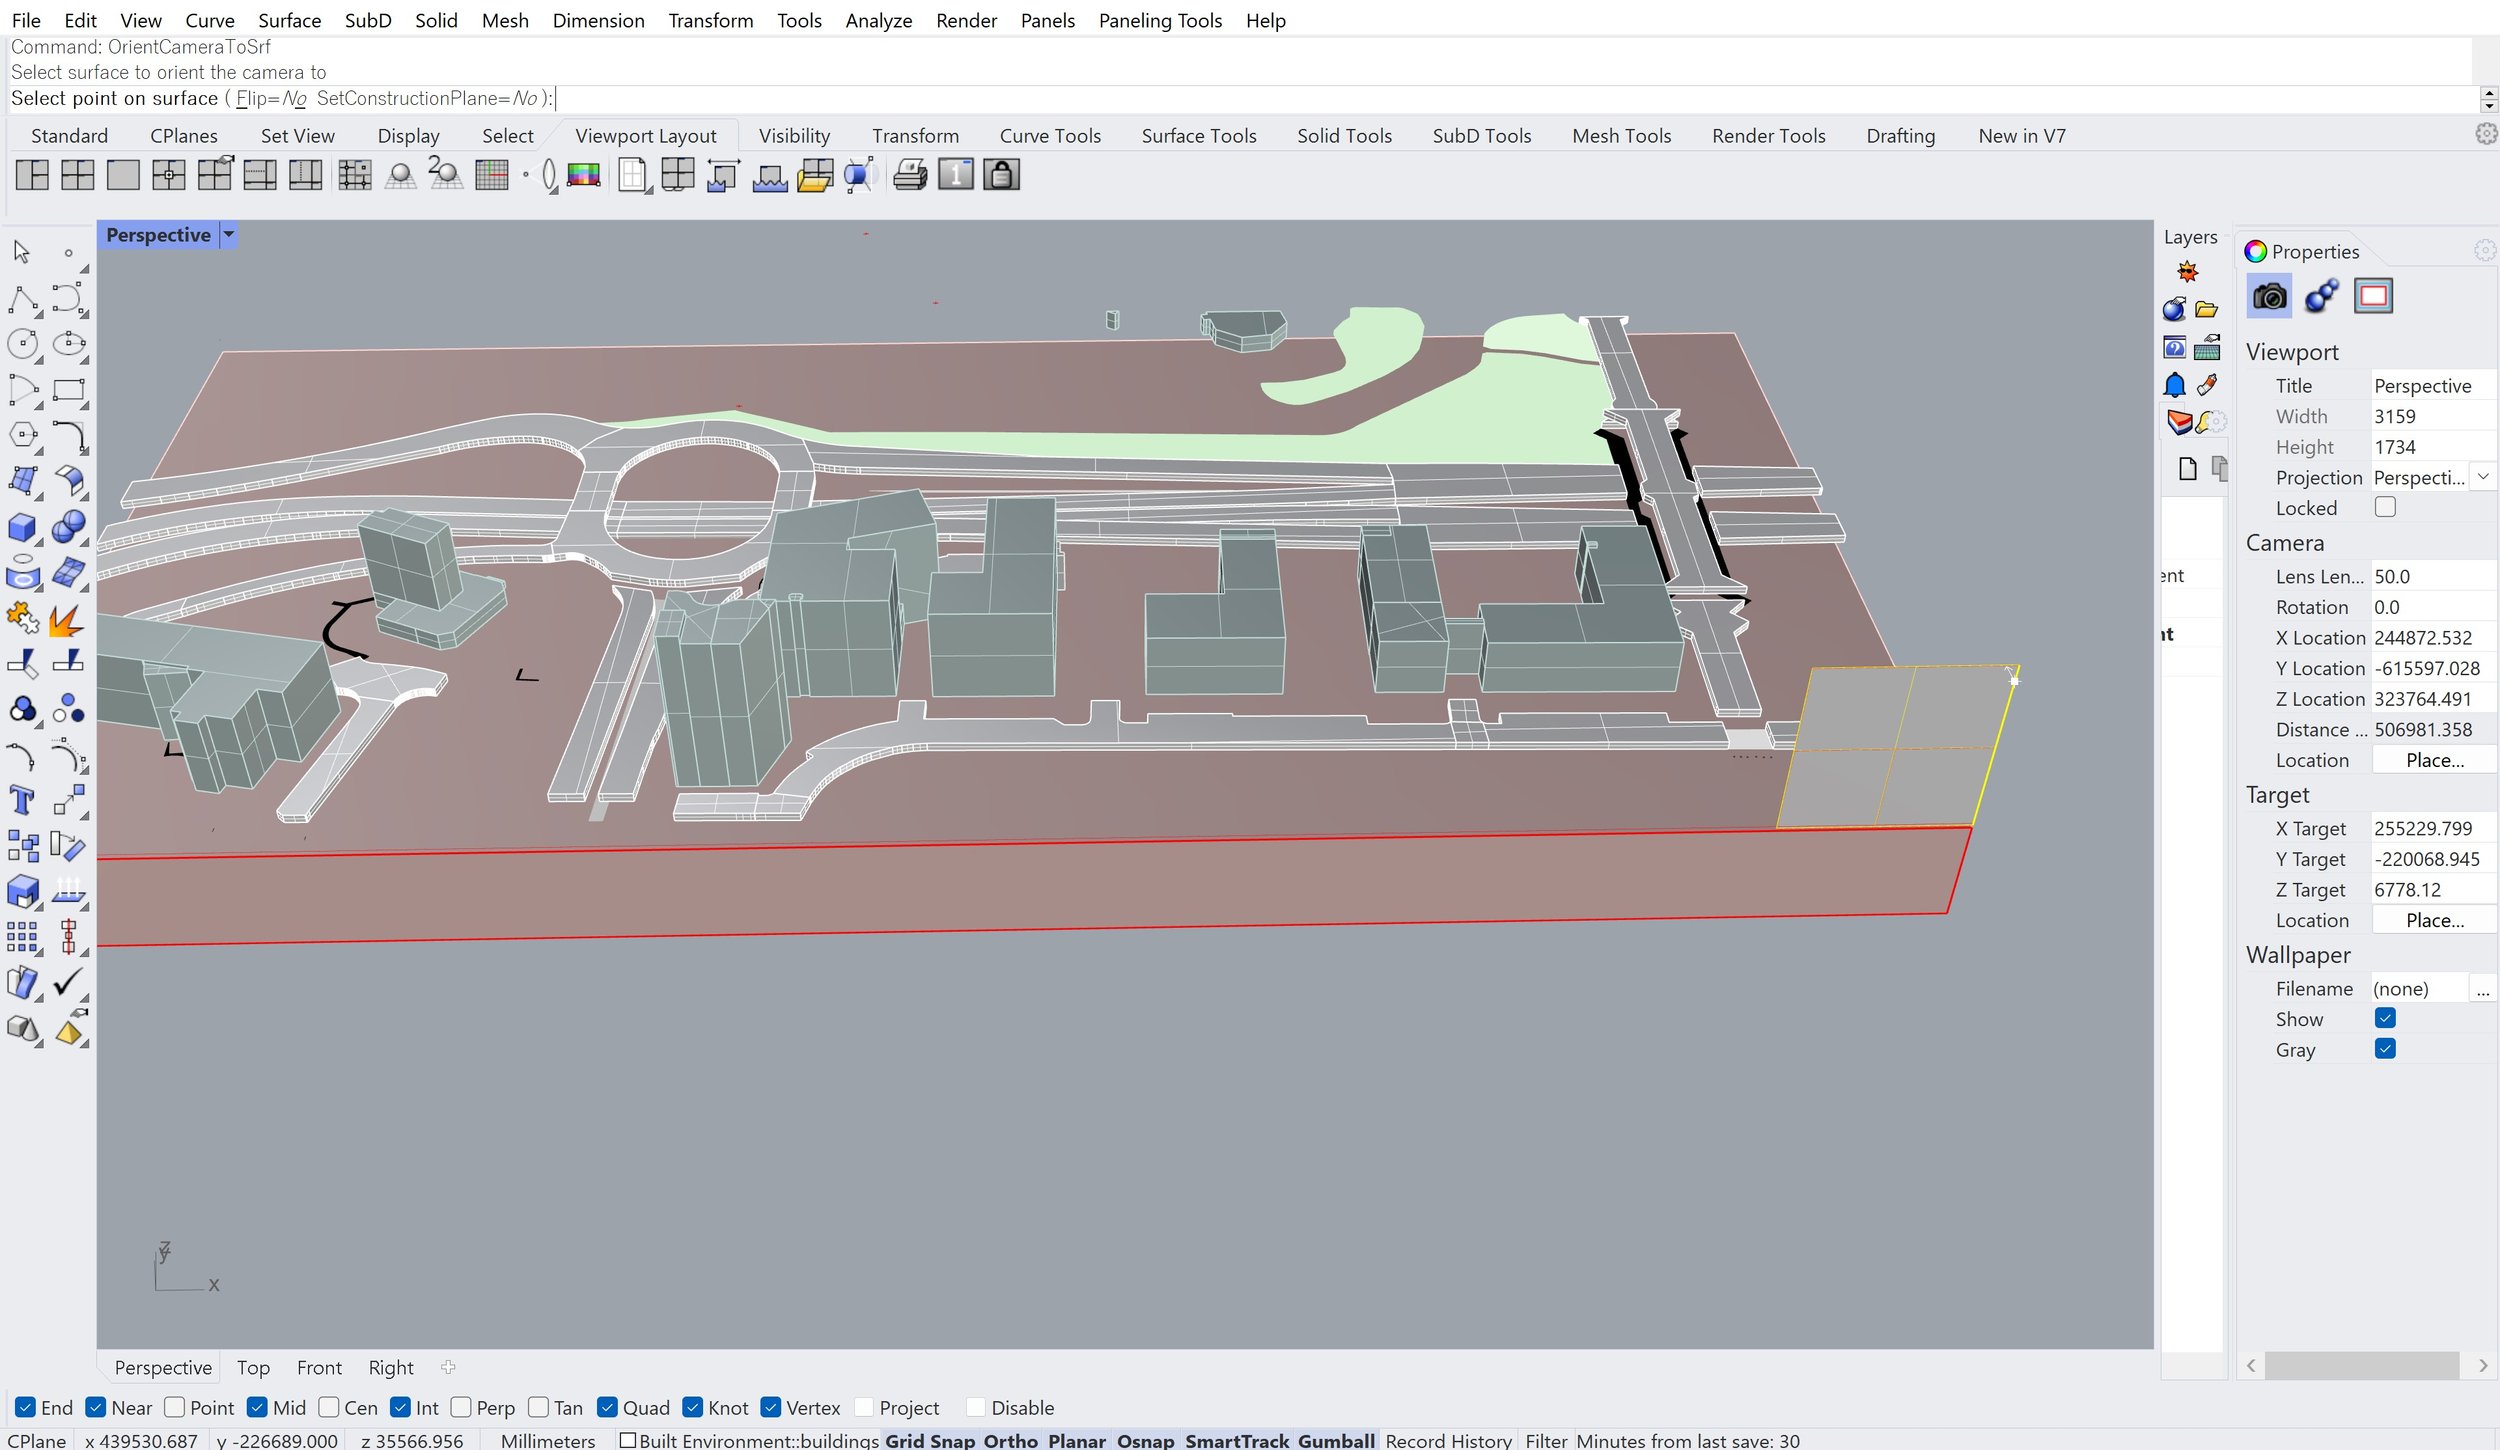
[11] Use the ‘_Plane’ command, enter ‘V’ or click ‘Vertical’, and create a rectangular plane over the clipping plane along the cut line.
[12] Type ‘OrientCameraToSrf’, click on the new plane, select any corner of the plane and enter. You should now be looking at your section from the correct angle.
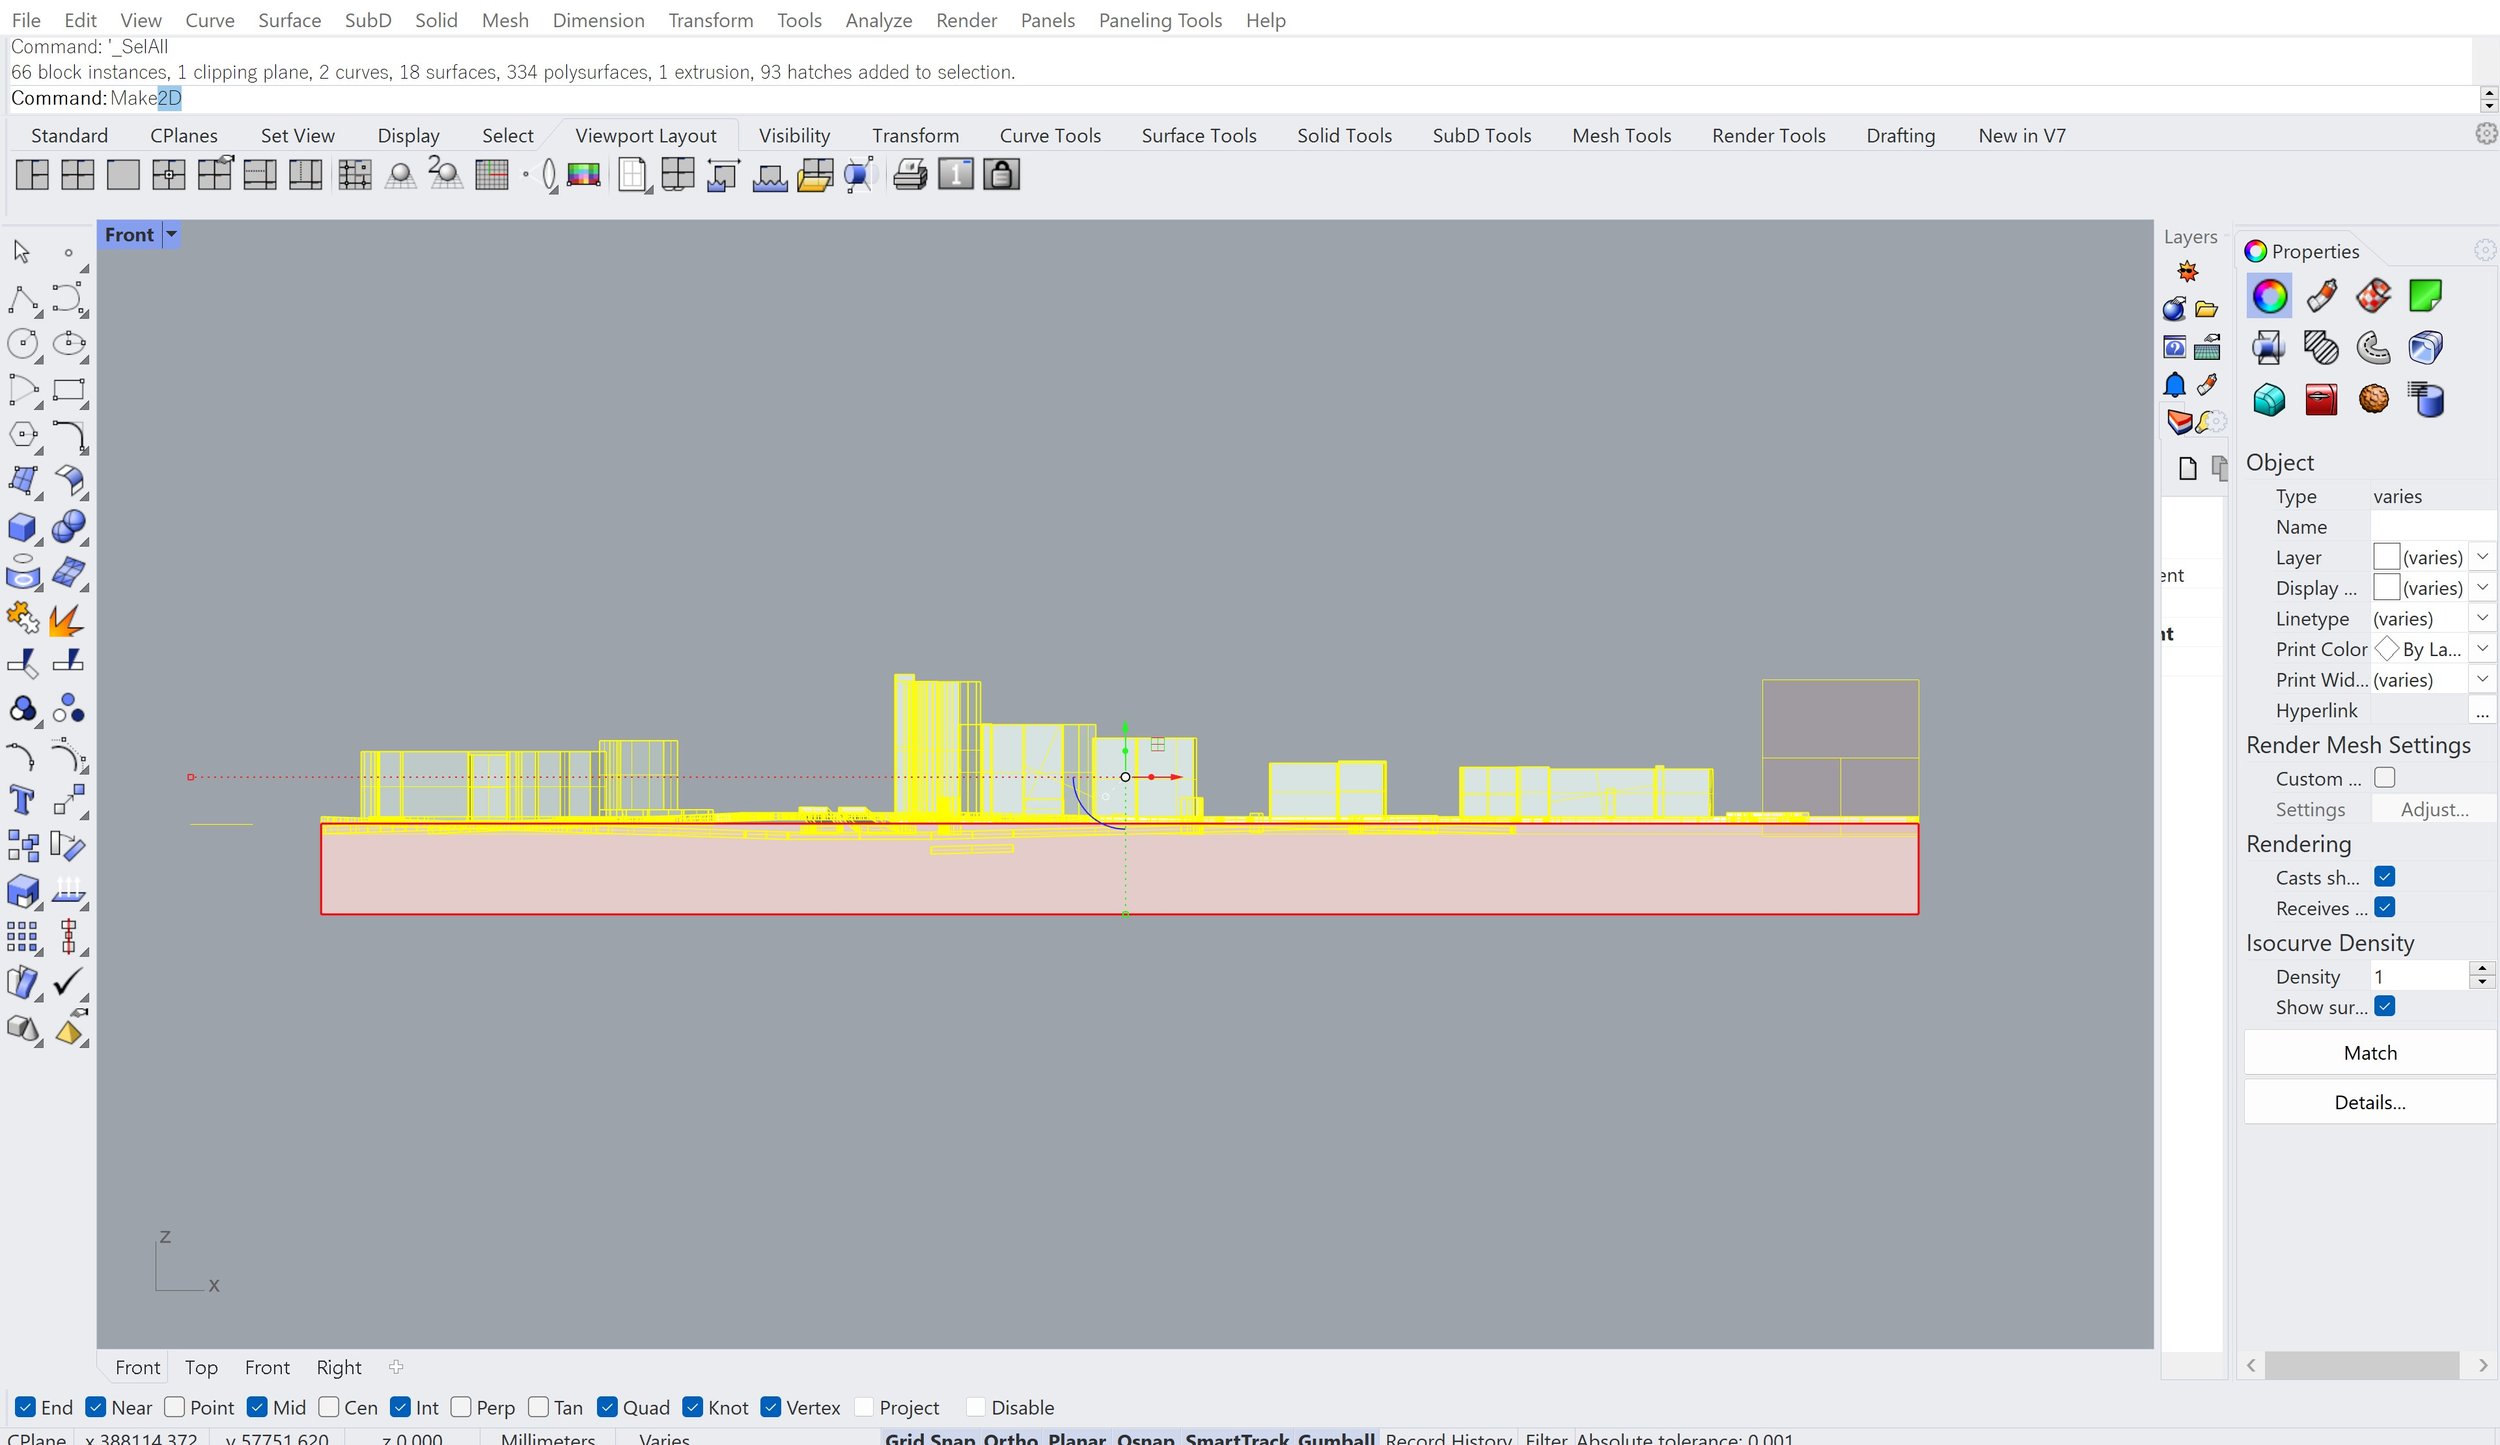
[13] Select everything, use the ‘Make2D’ command and wait for Rhino to generate a base 2D drawing of your model.
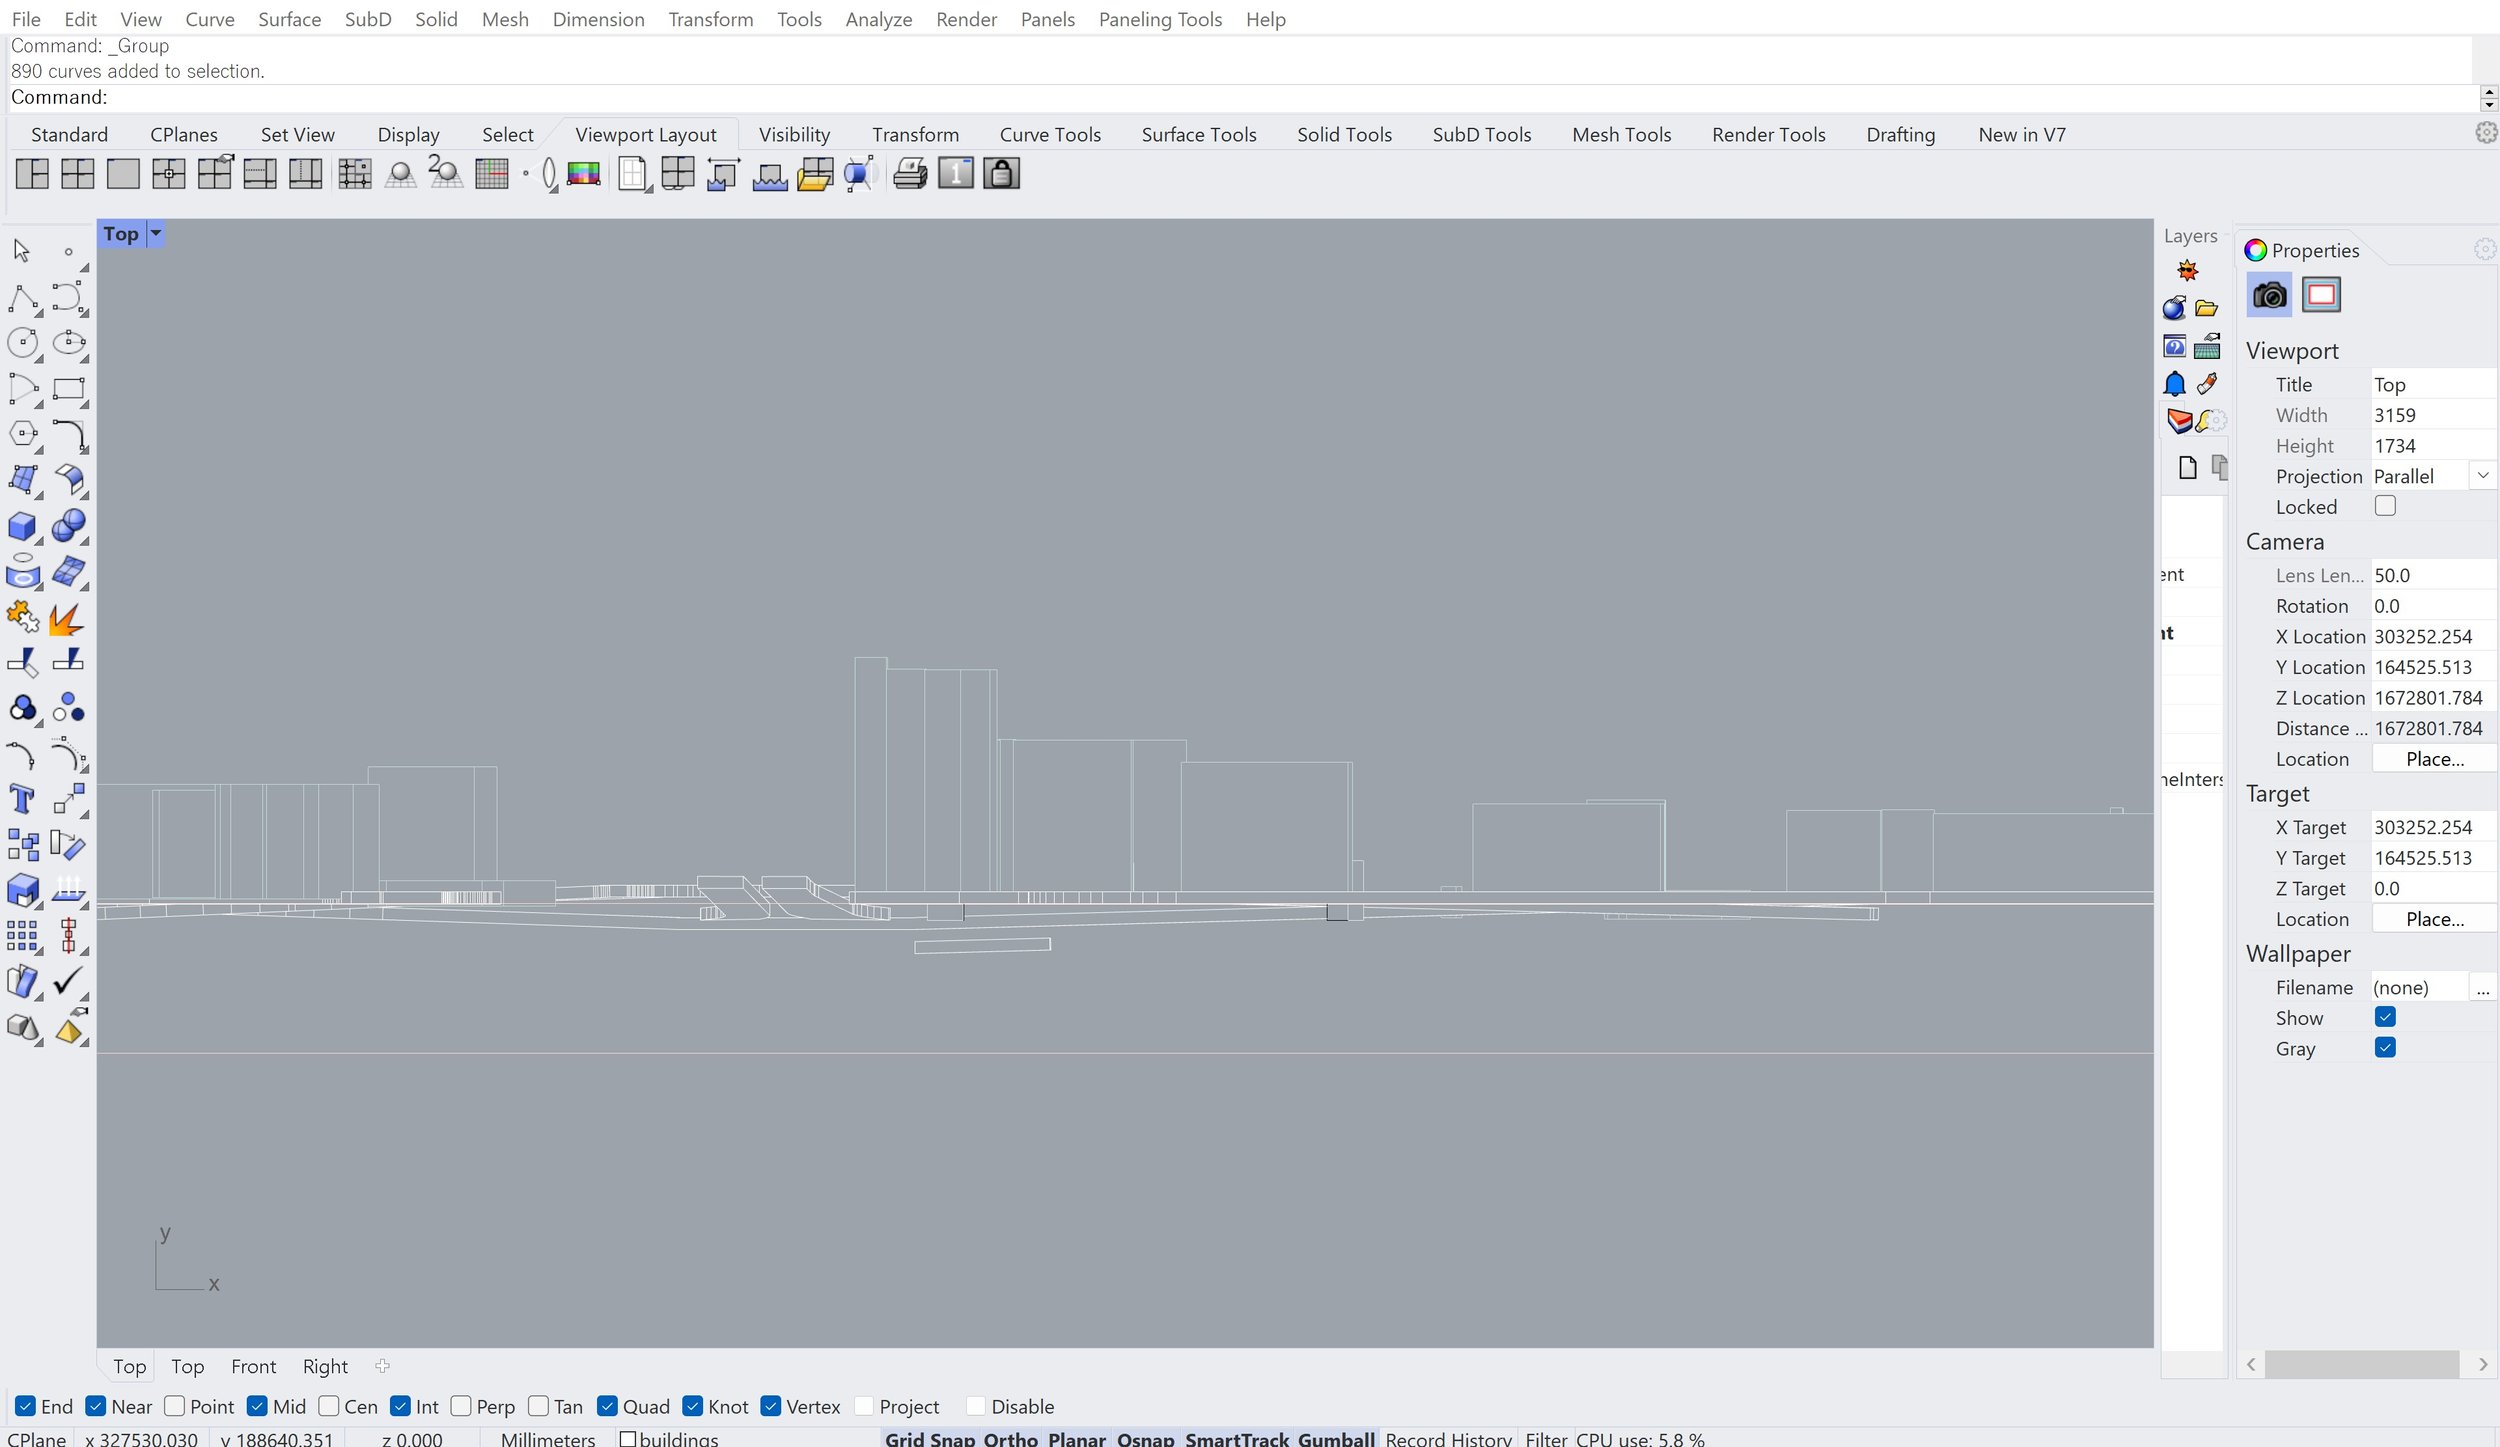
[14] Press ‘ZS’ once this is done to zoom into the drawing, and then group the lines together using the ‘Group’ command before moving the drawing to a different part of your workspace. You can ungroup it later if you need to. Clean up your section by deleting or trimming any lines that shouldn’t be in your section using the ‘Trim’ command.
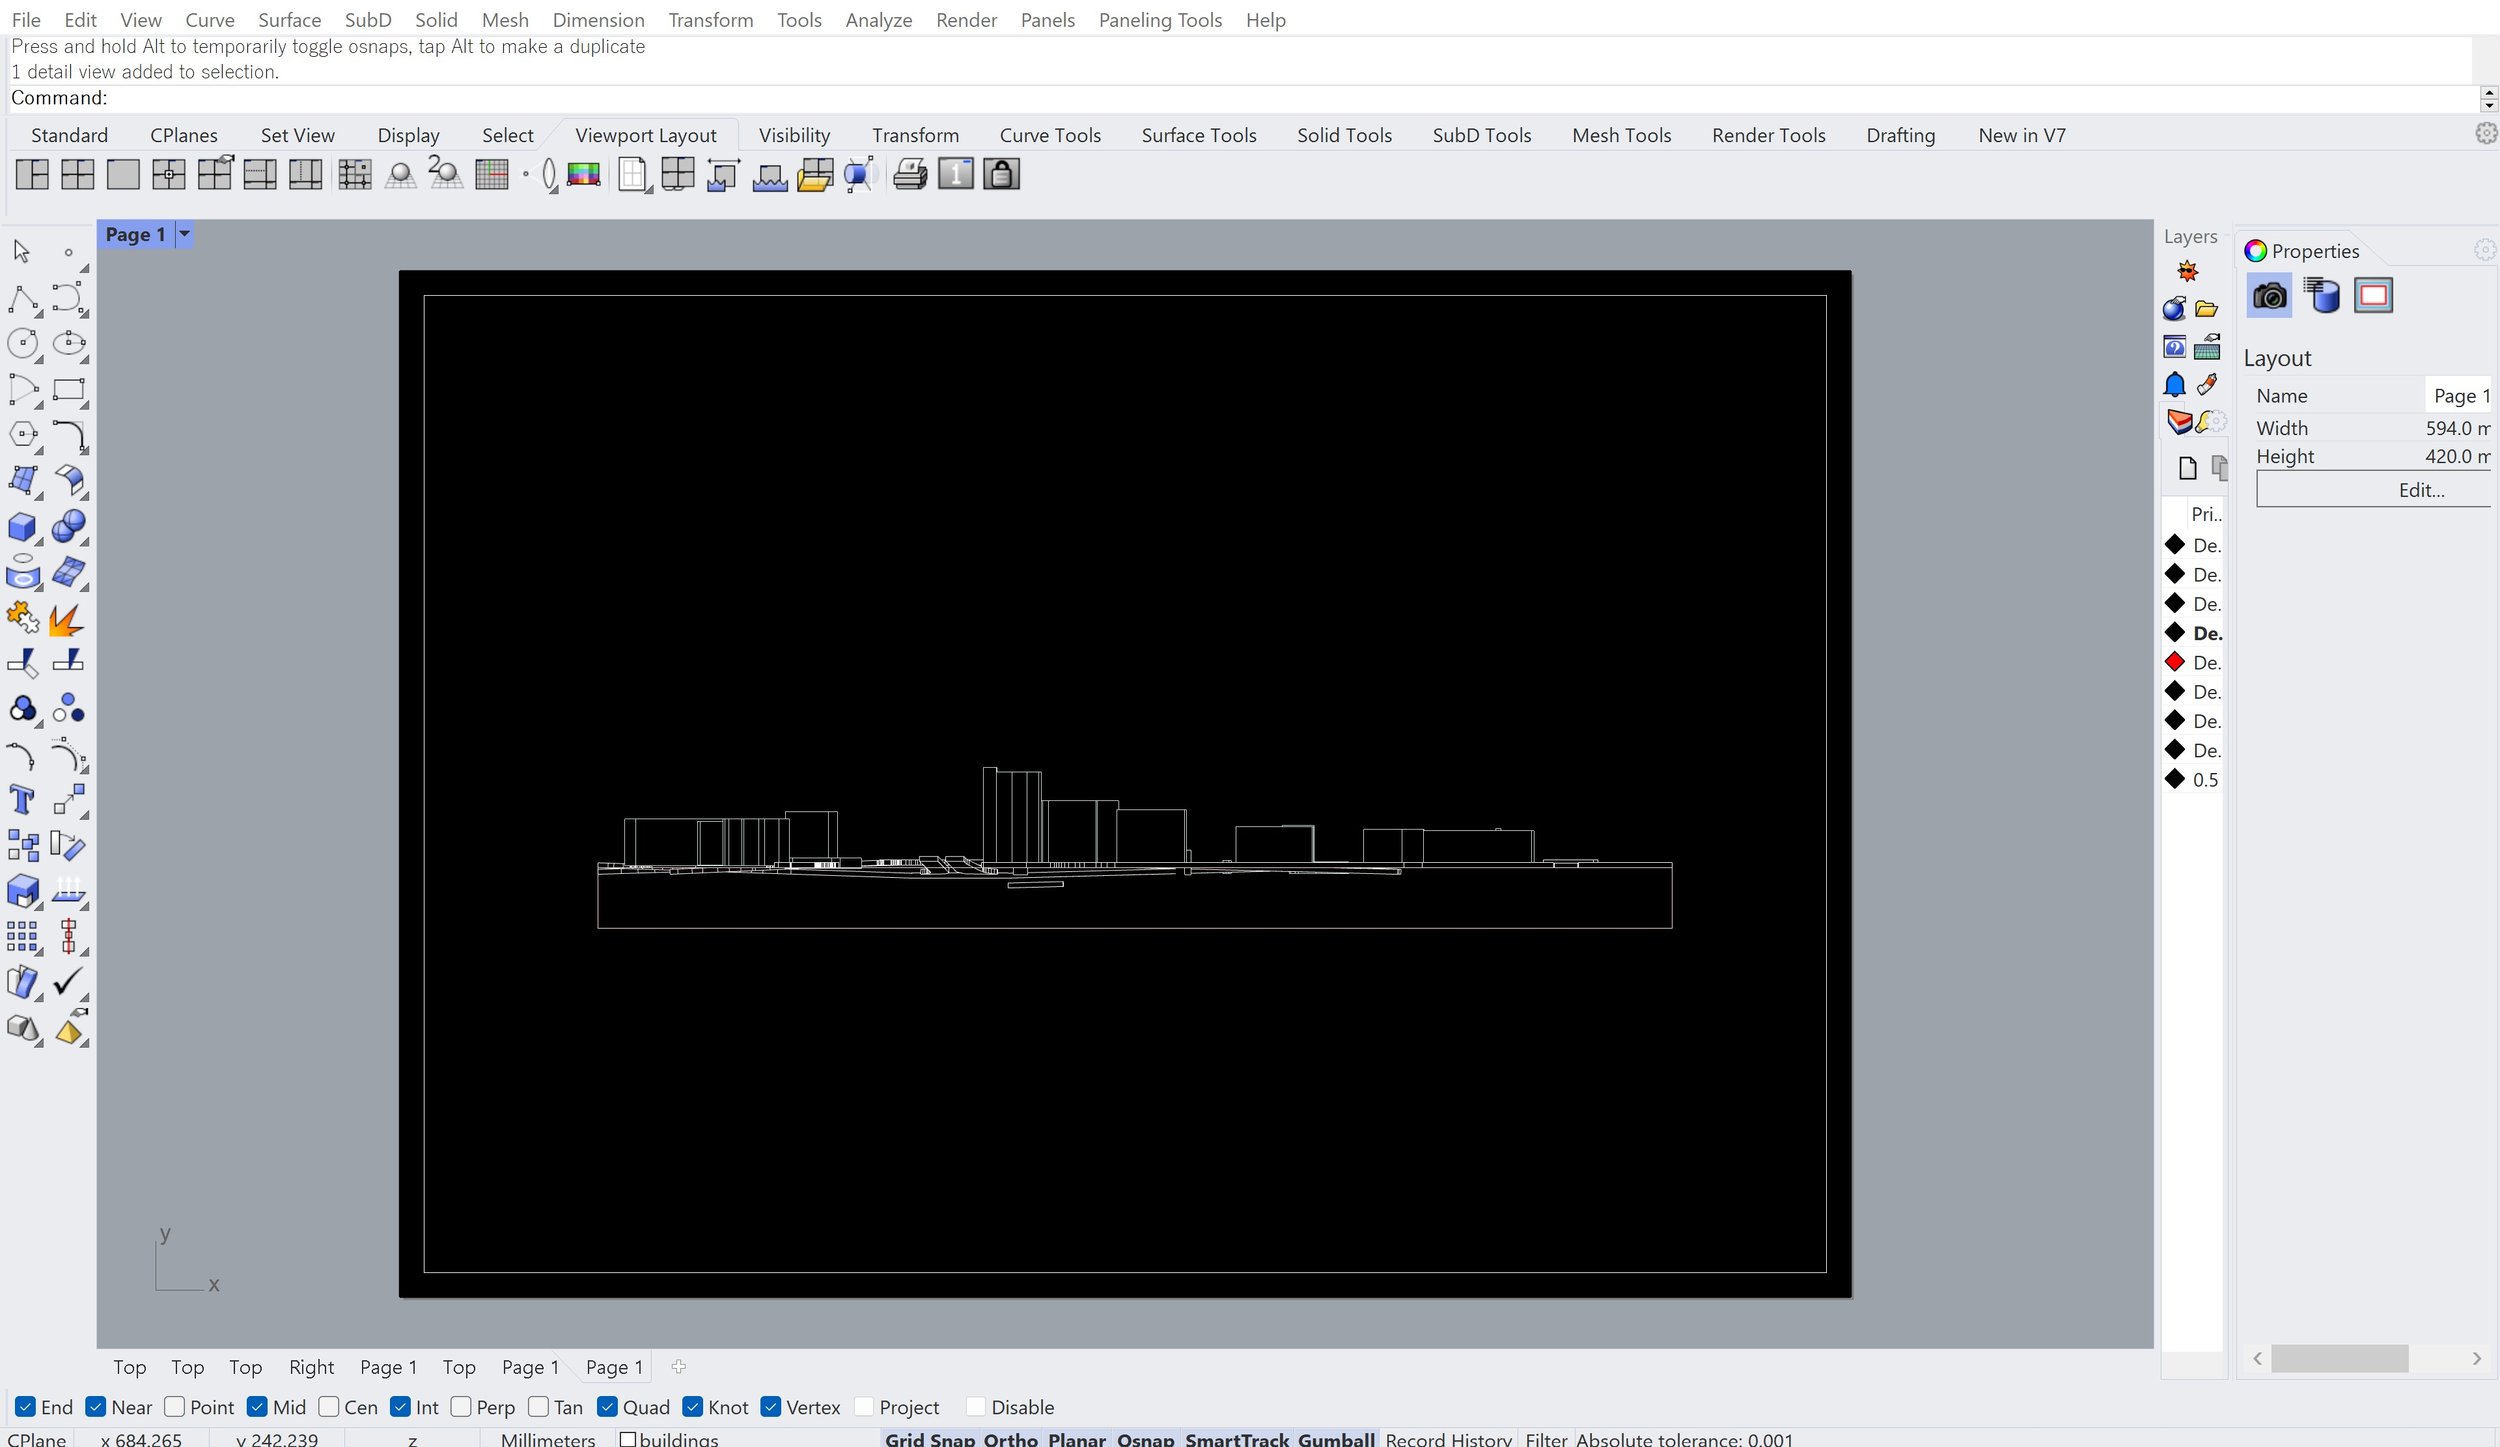
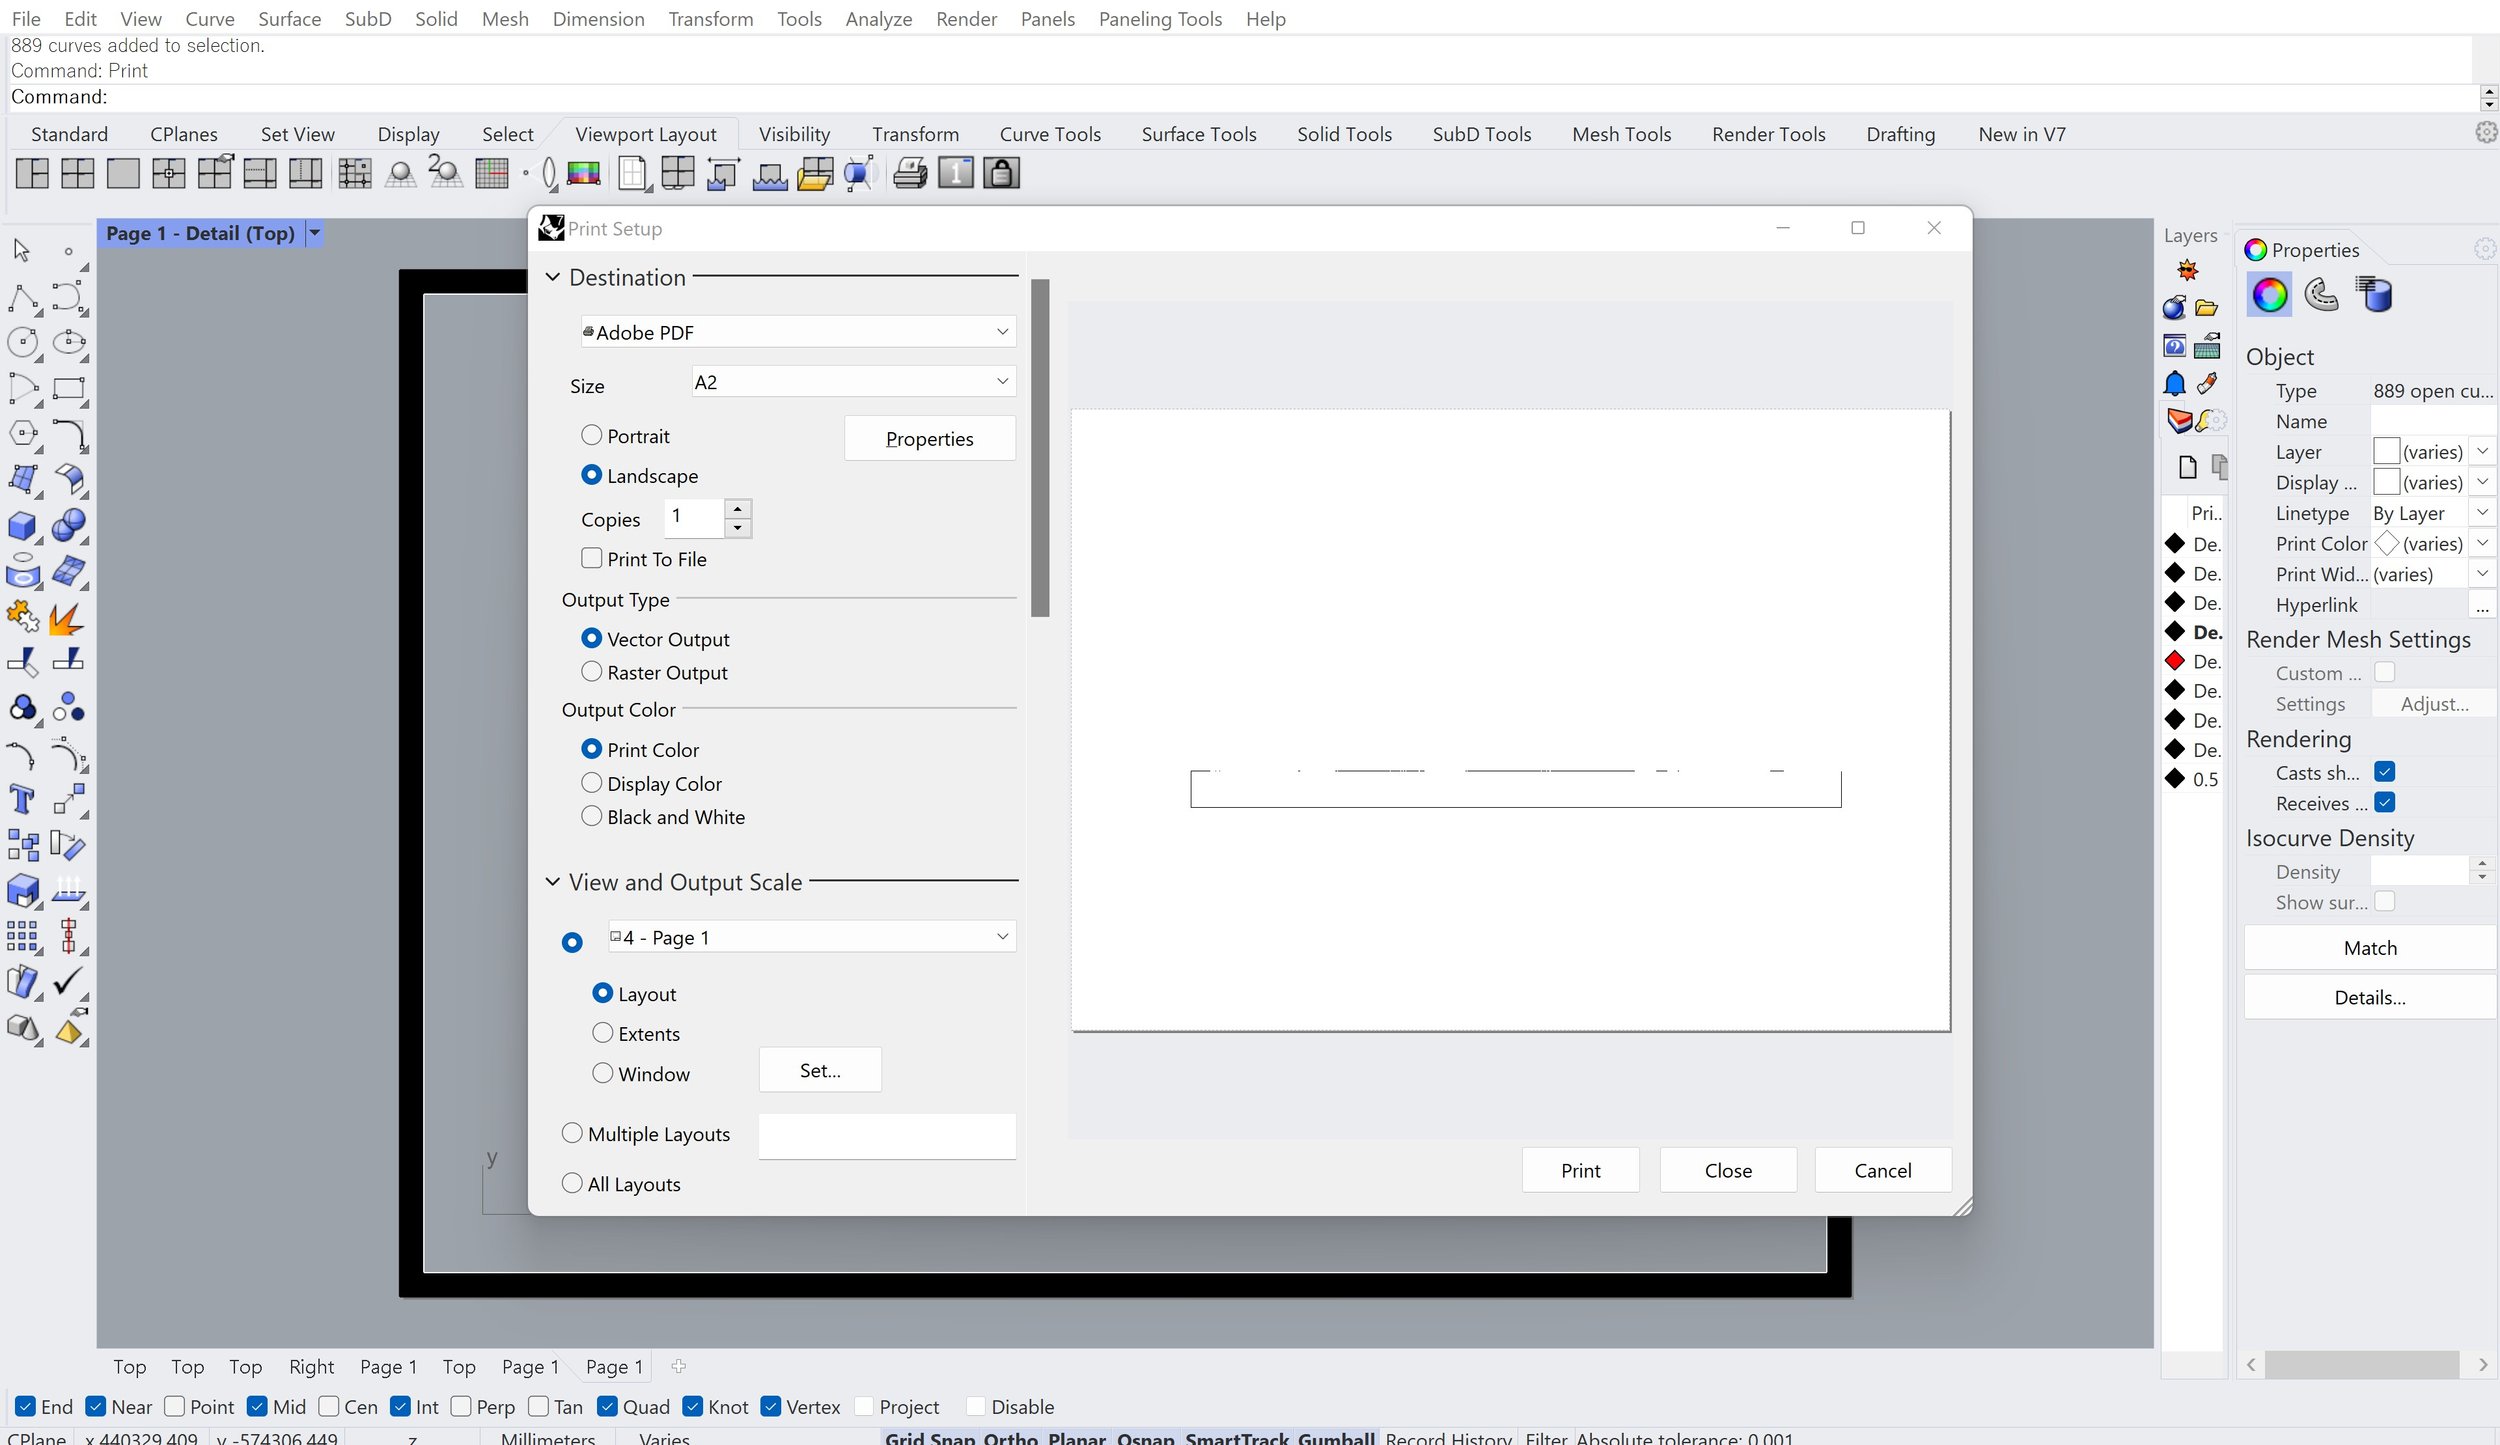
[15] To scale your drawing to the correct dimensions, type ‘Layout’ in the command bar. Select your page size and orientation (typically A2 Landscape) and name your drawing. Double-click to move and re-position your drawing, and double-click again to set the new position.
[16] Type in ‘Print’ to export your section as a vector drawing at the page size you need in a PDF format.
You can also edit line weights and add hatches in as needed in Rhino before proceeding with the tutorial, or do post-production in another programme like Illustrator or Photoshop.
Environmental Factors
Sun
Now that you have a base section to work with, we’re going to add in the data that turns your drawing into a bioclimatic section. We’ll start with the sun angle.
First, determine the dates and times for which you want to represent the sun path on your drawing. Once you develop your project further, you’ll probably have a better idea of more specific times of the year that relate to the occupancy of your project (for example, if you’re designing for a school, term-time dates are more relevant to explore environmental conditions than the summer holidays). However, the summer solstice, winter solstice and equinox are standard times of the year that you can use for initial site sections, which is what we’ll be using for this tutorial. For reference, these are as follows:
Summer Solstice: 21 June (longest day of the year)
Equinox: 21 March/September (midpoints of the year)
Winter Solstice: 21 December (shortest day of the year)
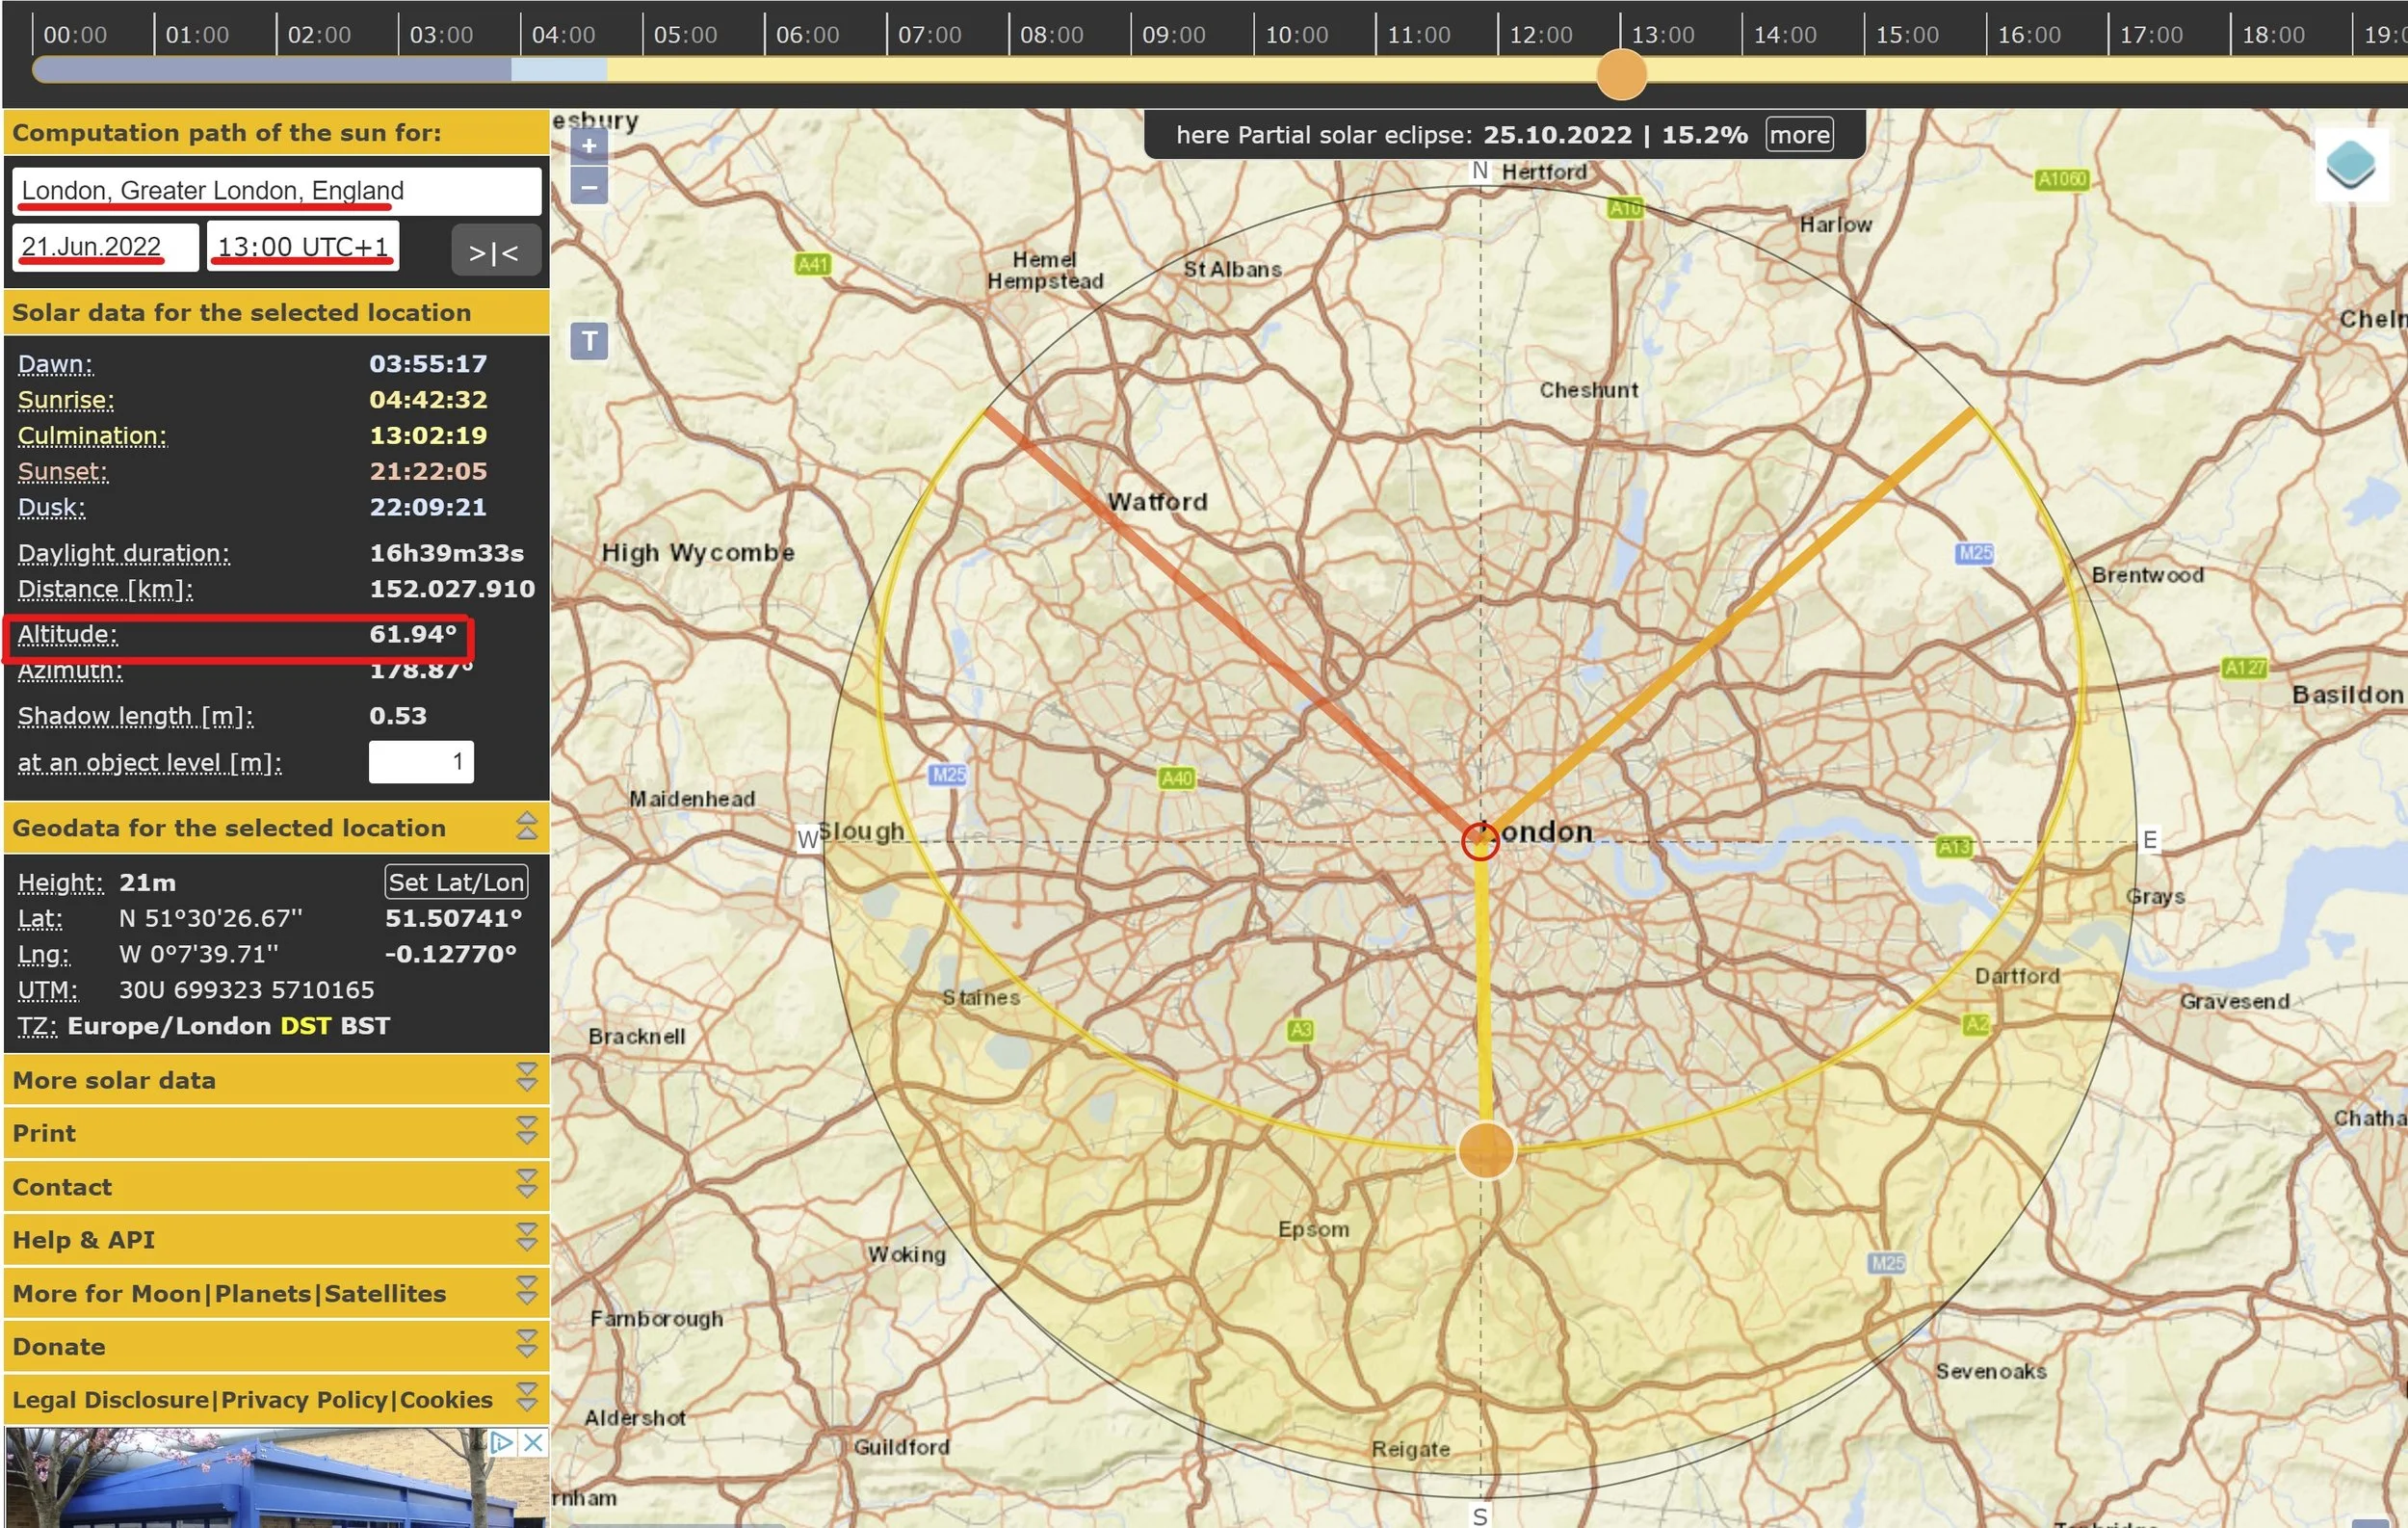
[1] Go to https://www.suncalc.org/ and enter the location of your site, and the date/time of your first sun position. In the solar data menu, you should see data for the altitude of the sun at this given time: this is the angle of the sun ray that you’ll be adding to your section. Take note of this figure and repeat for all your chosen sun position times.
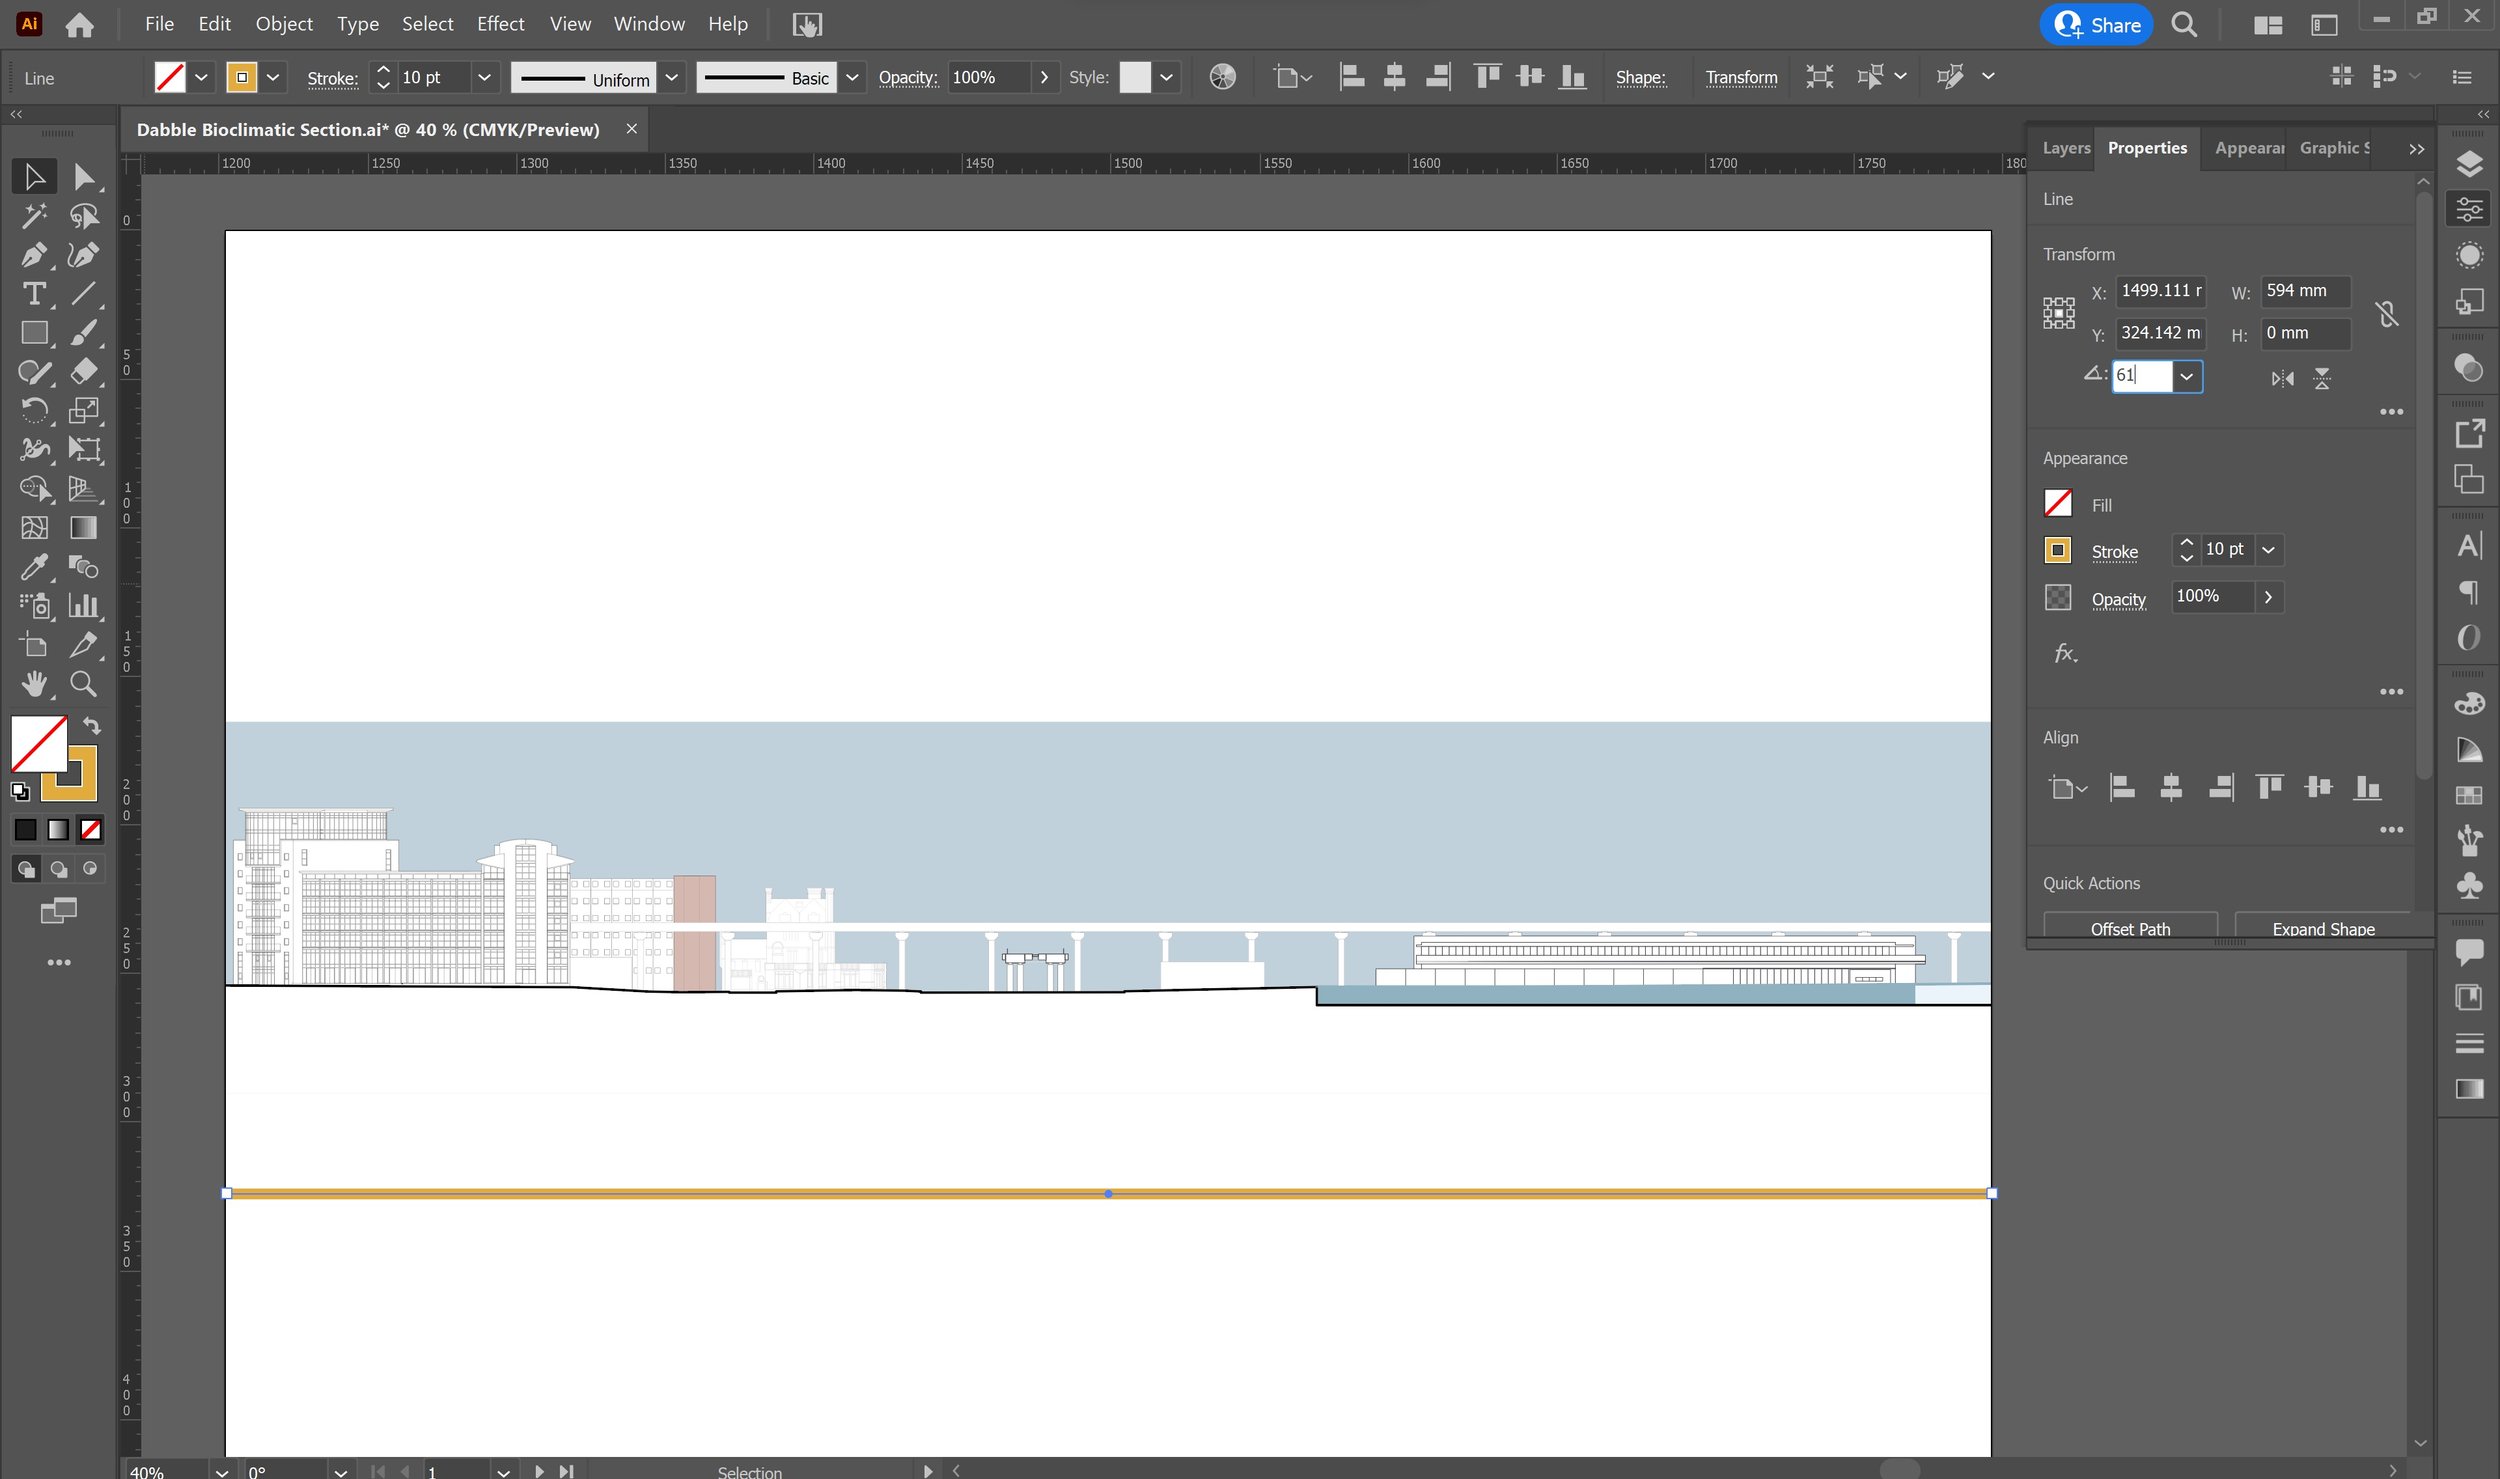
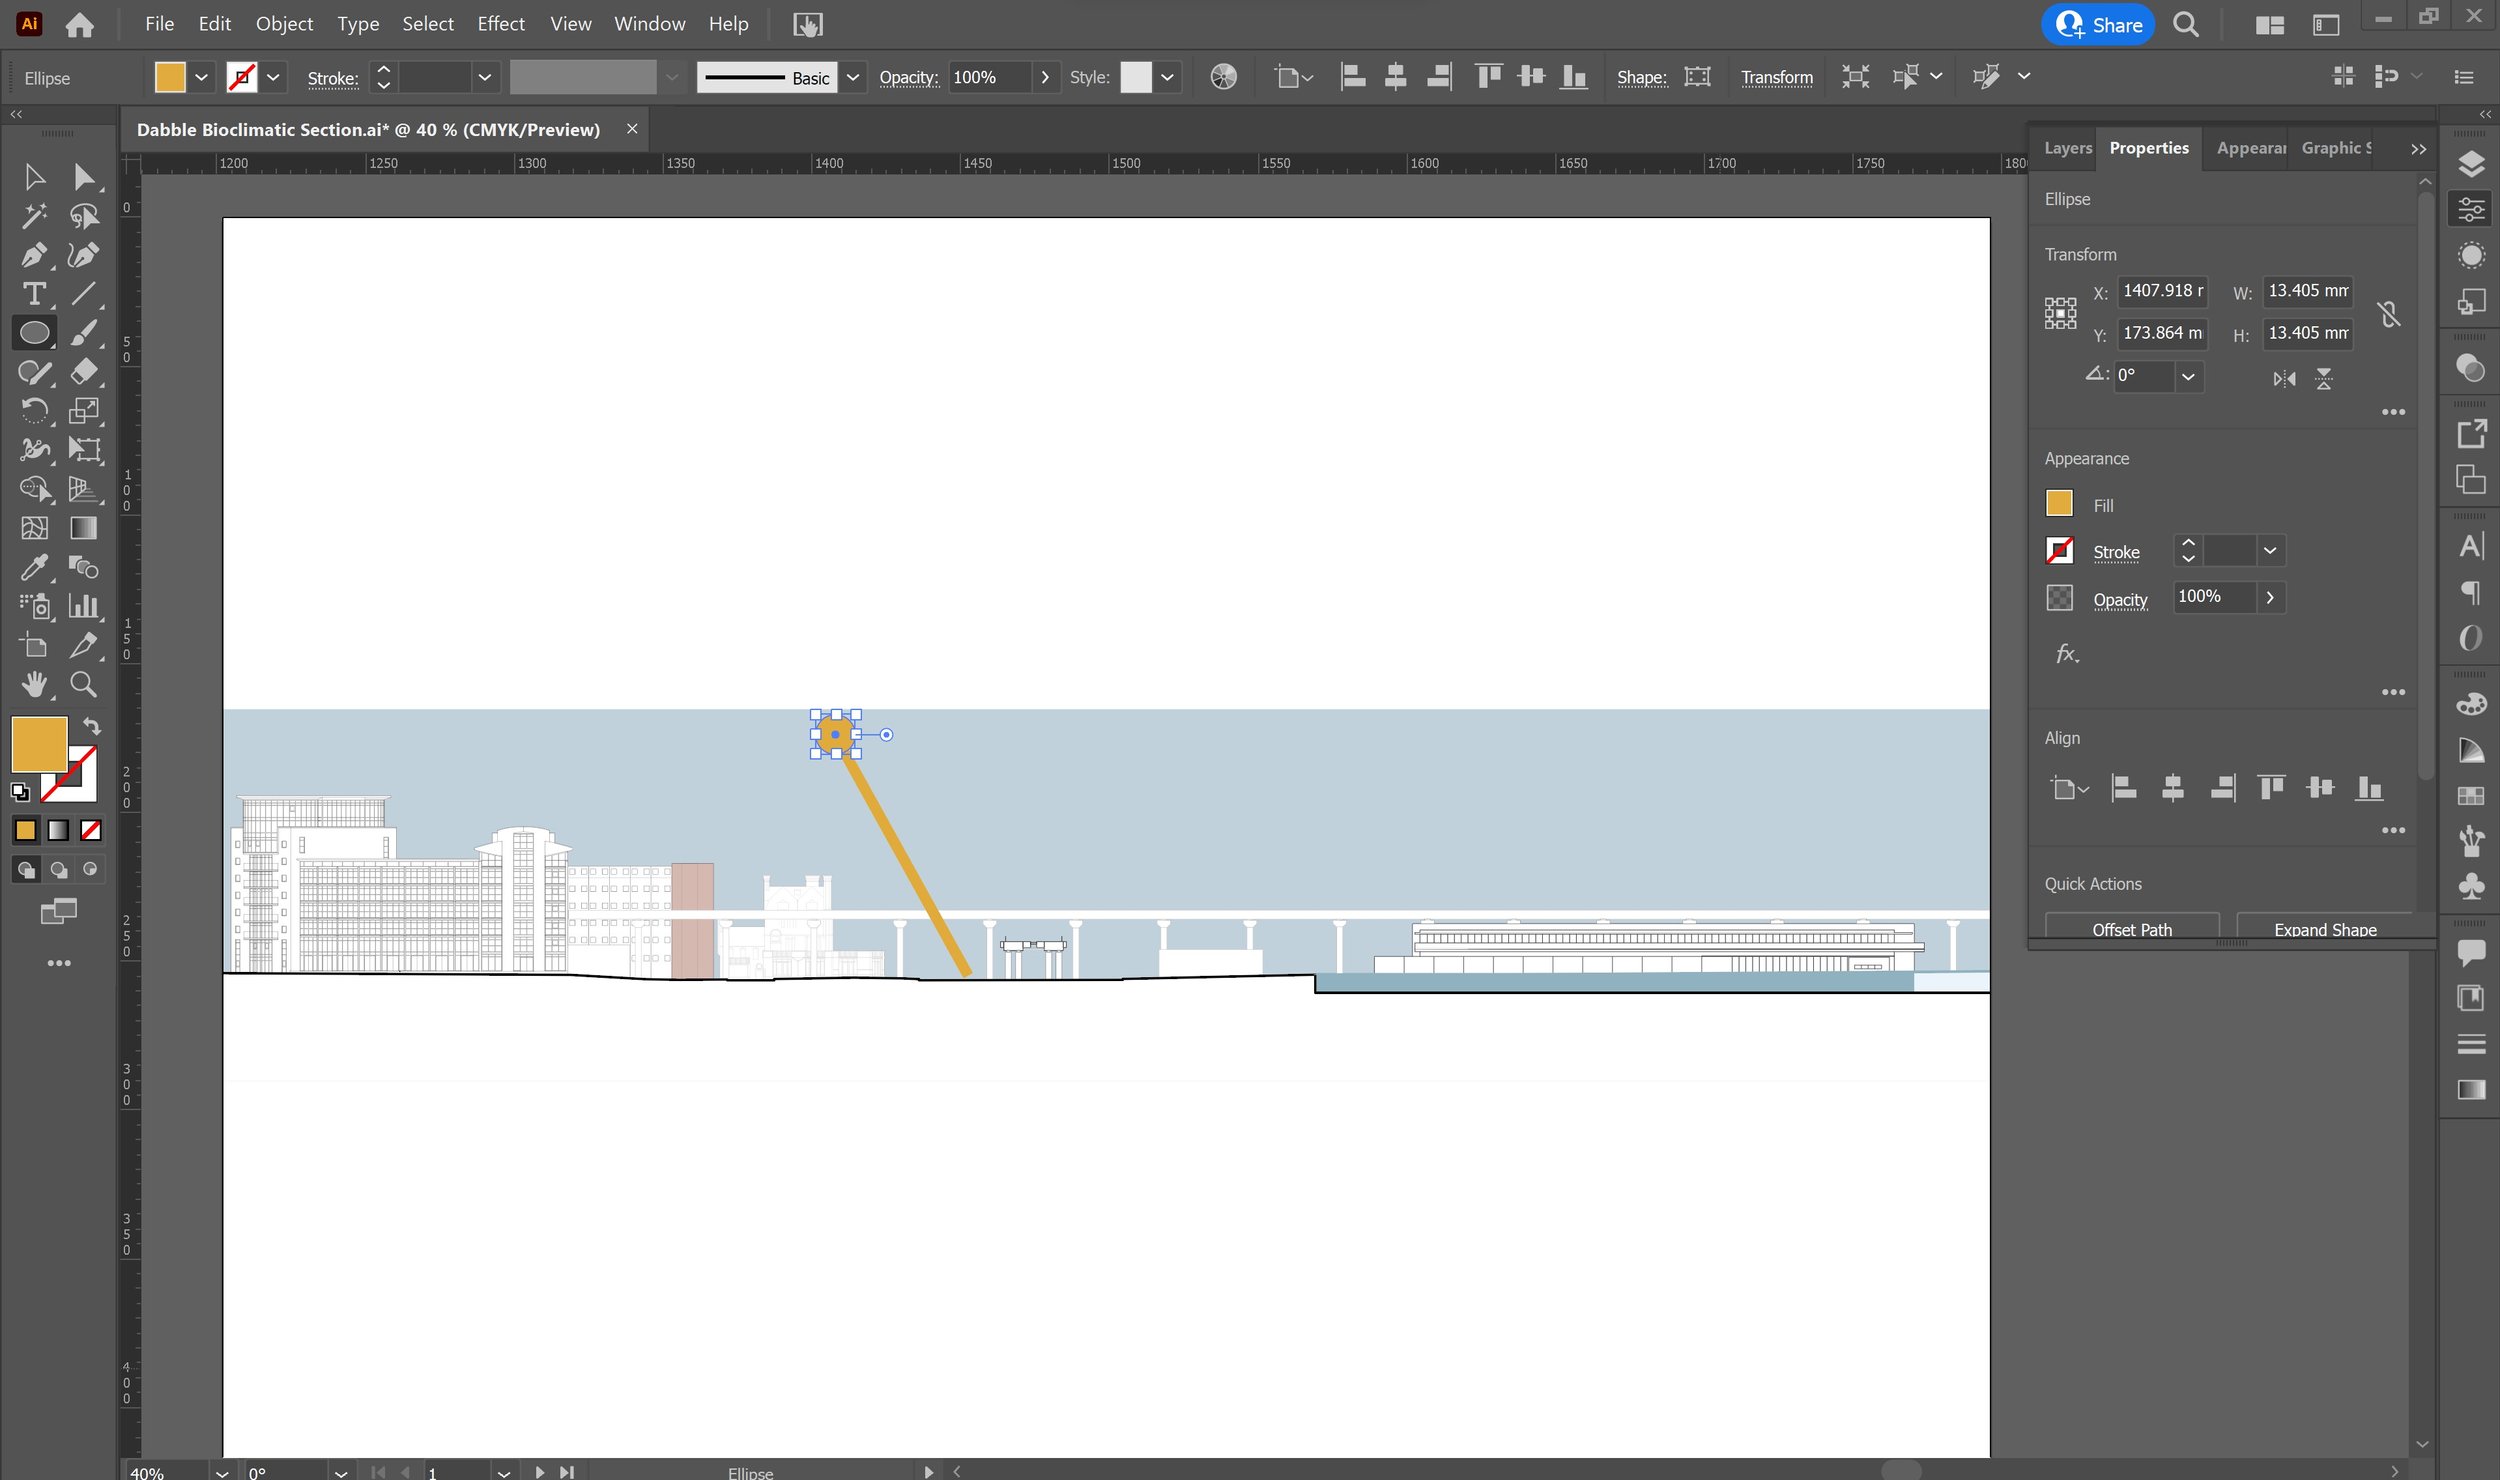
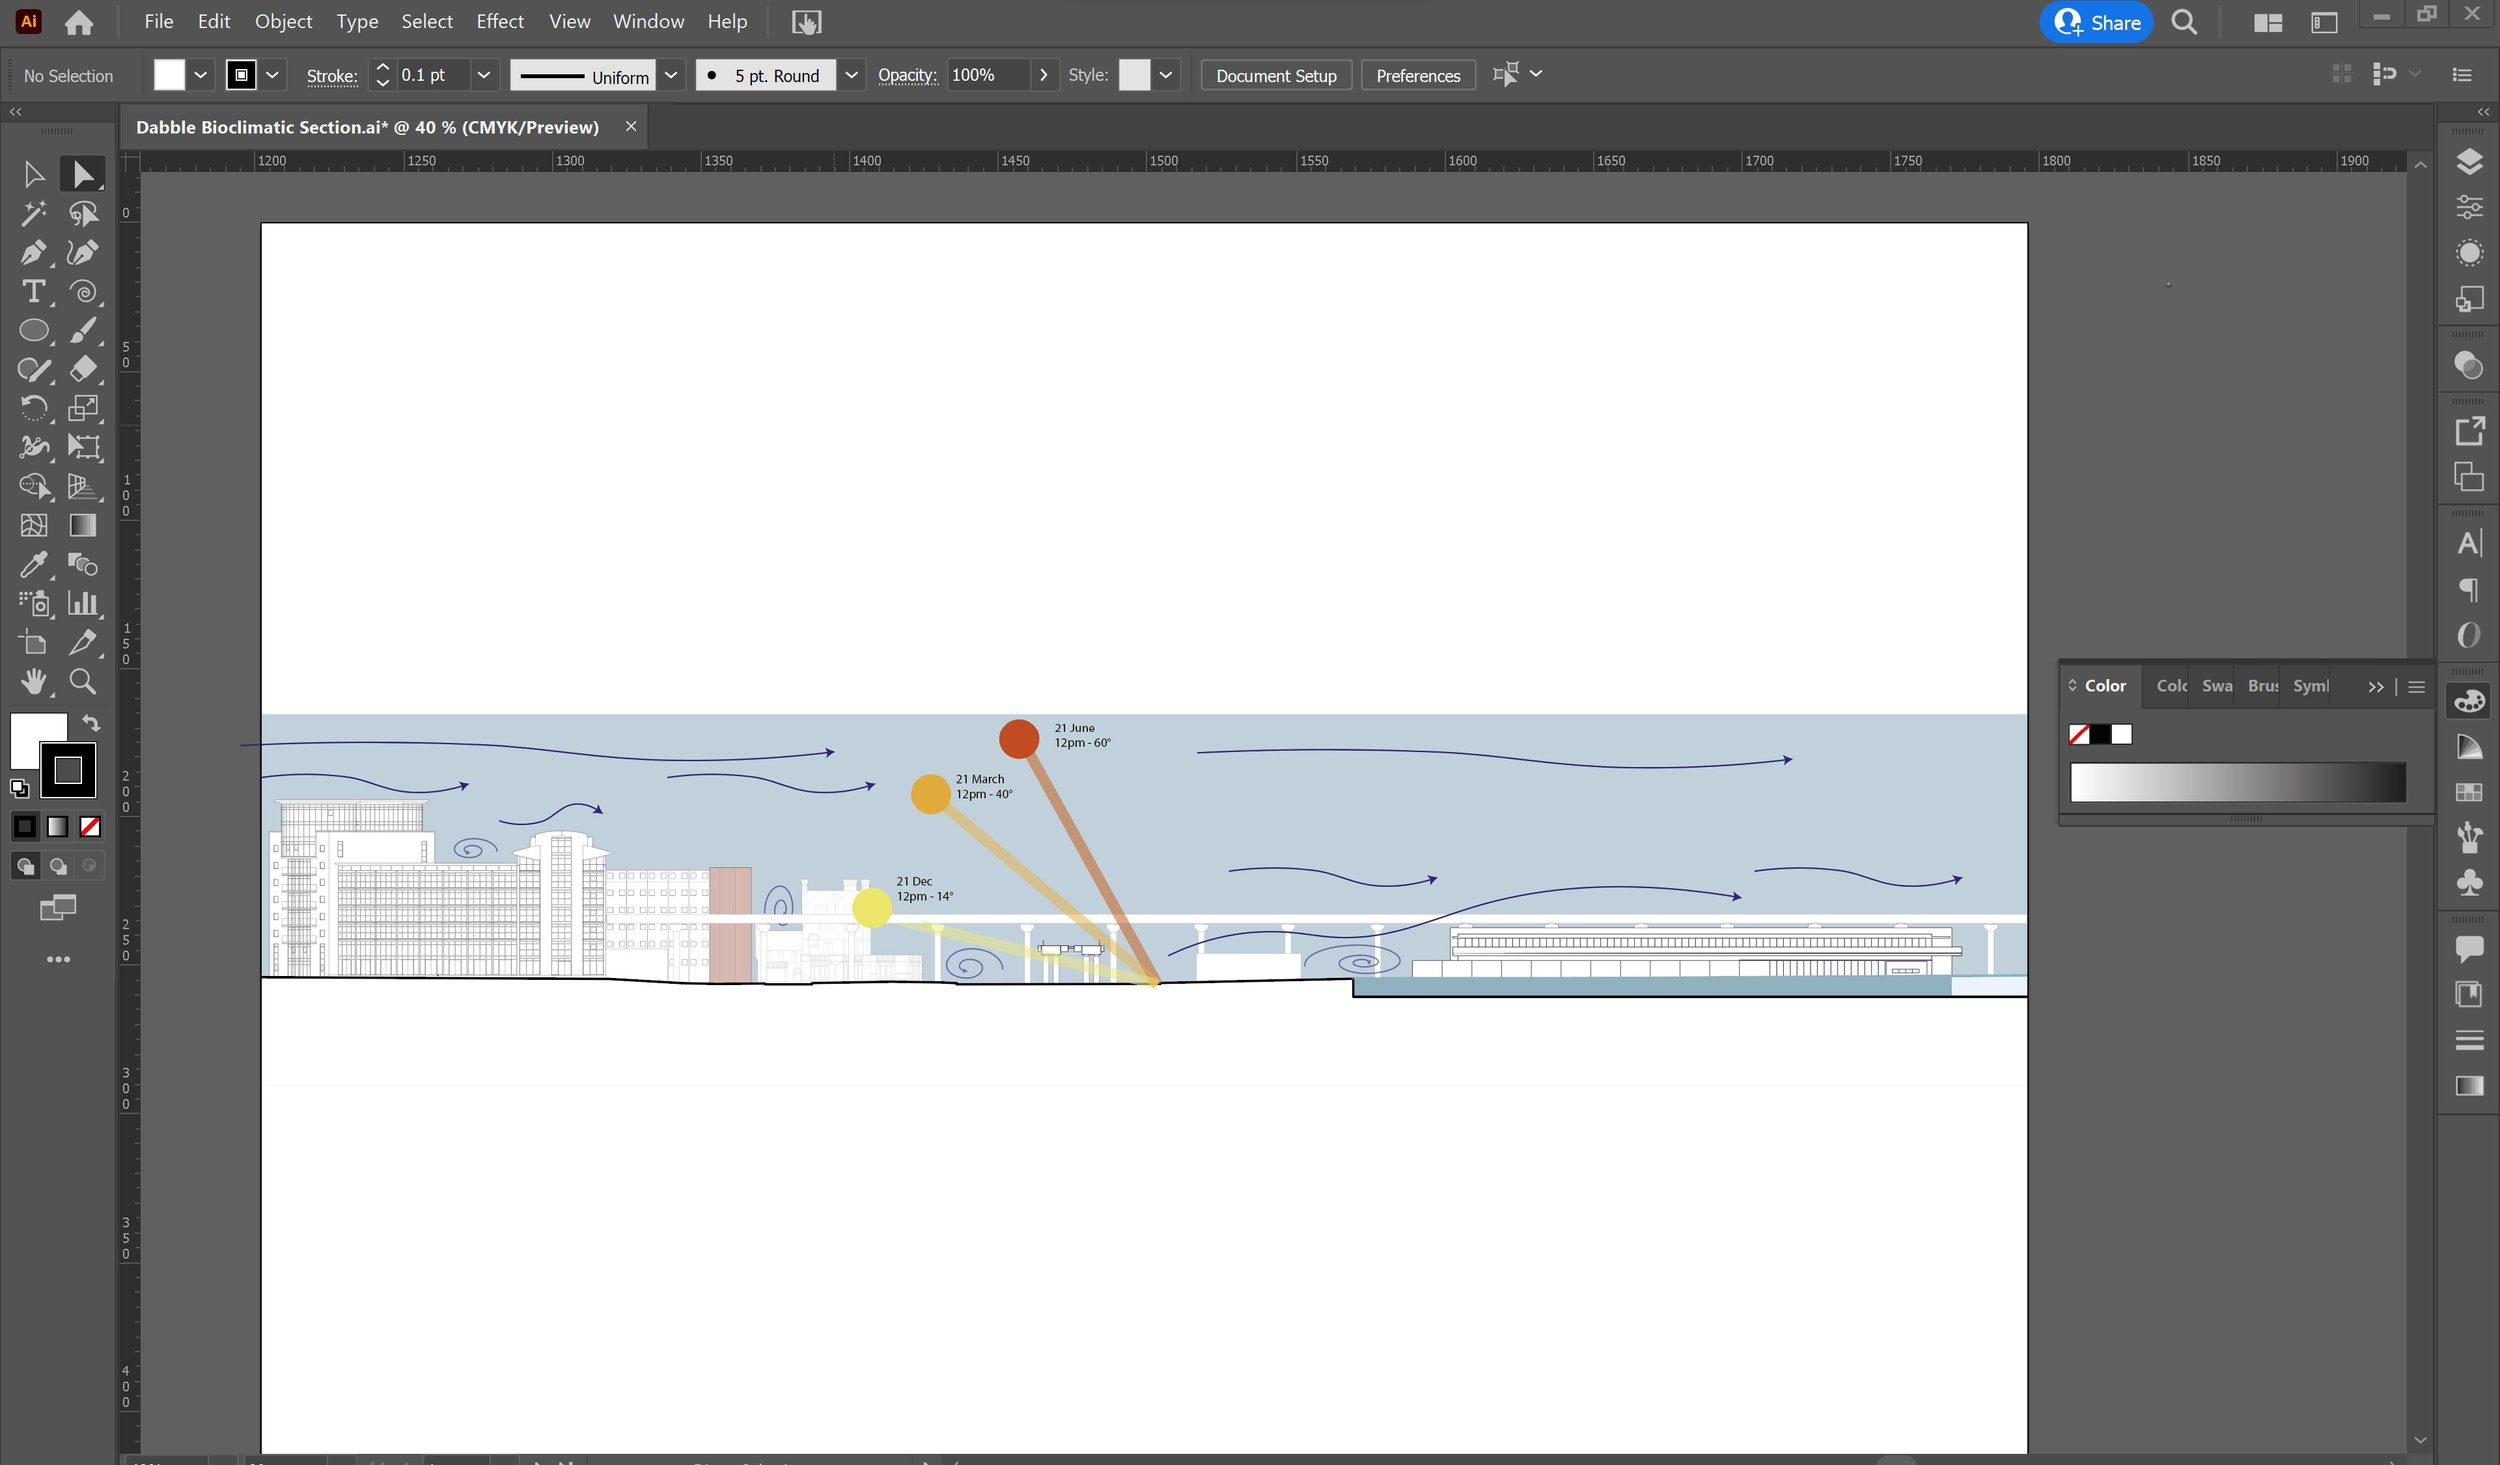
[2] Open up your section in Illustrator and position it on the page as desired. Using the pen tool or line tool, draw a horizontal line across the page.
[3] Go to the properties tab and rotate it according to the sun angle of your first sun position, by entering the angle into the Properties panel.
[4] Make a small circle using the circle tool and position it on the upper end of the line, which will represent the sun.
[5] Add a label using the text tool with the angle of the altitude, date and time of the sun position.
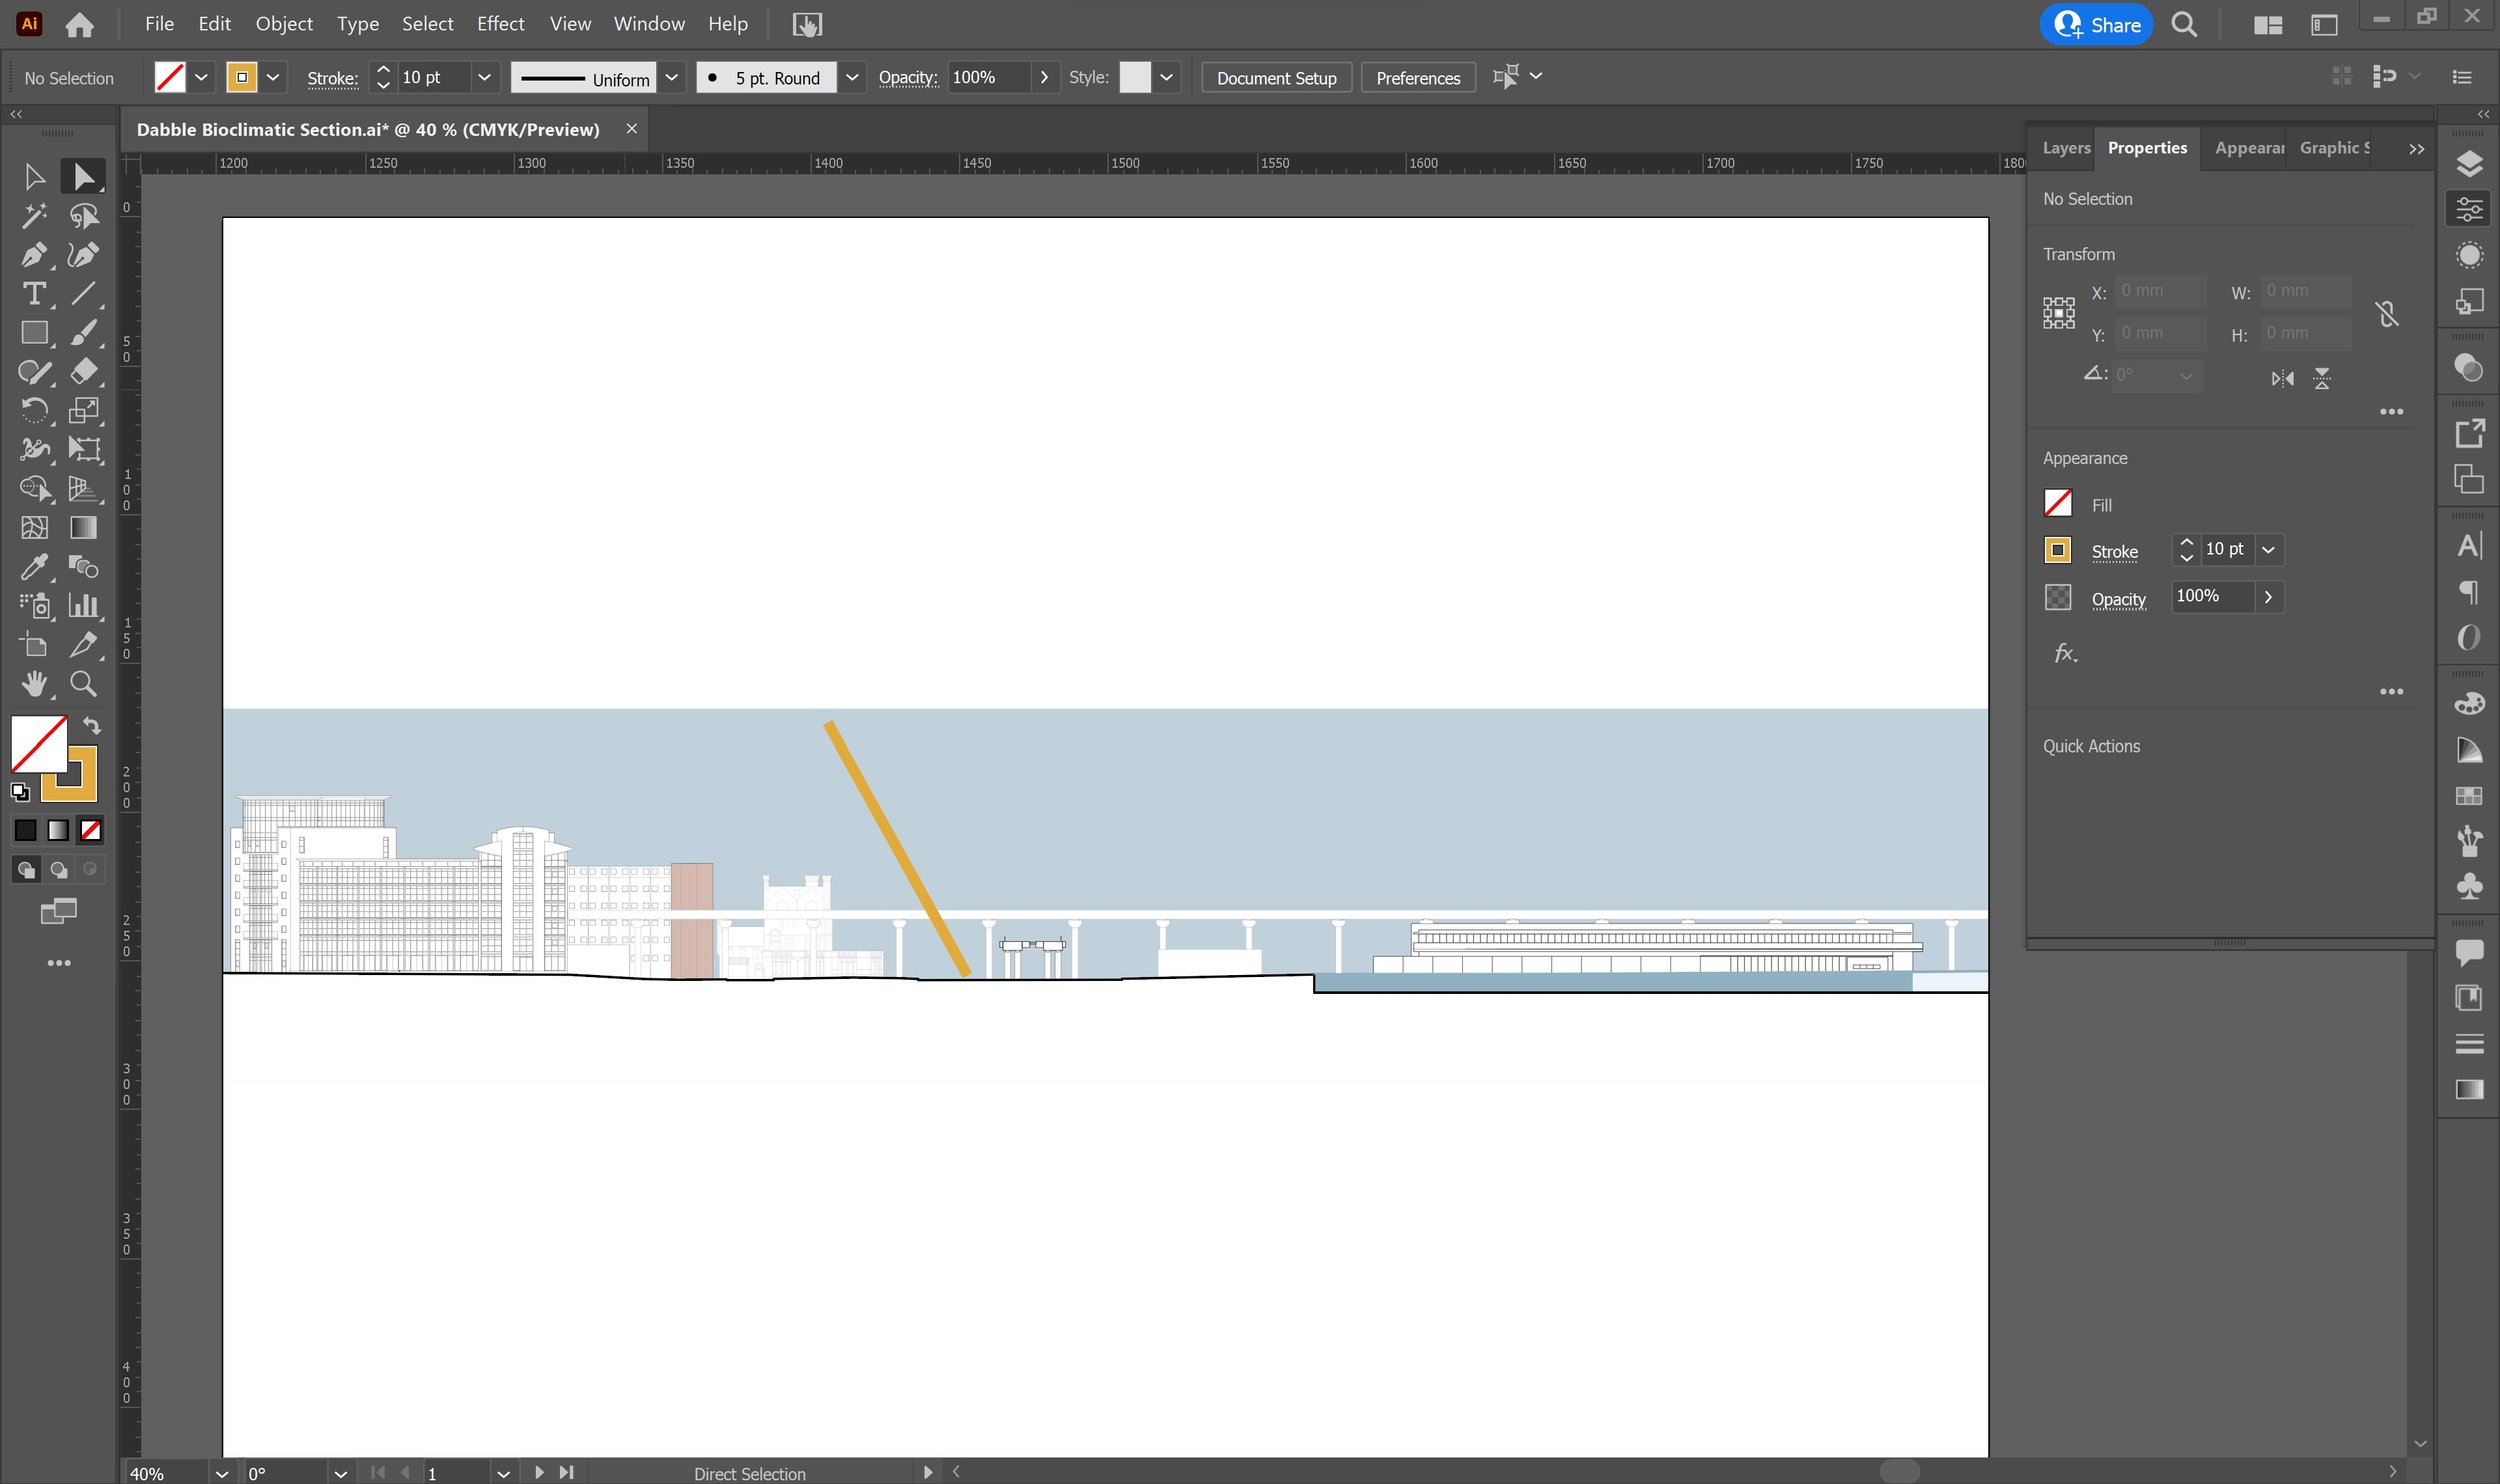
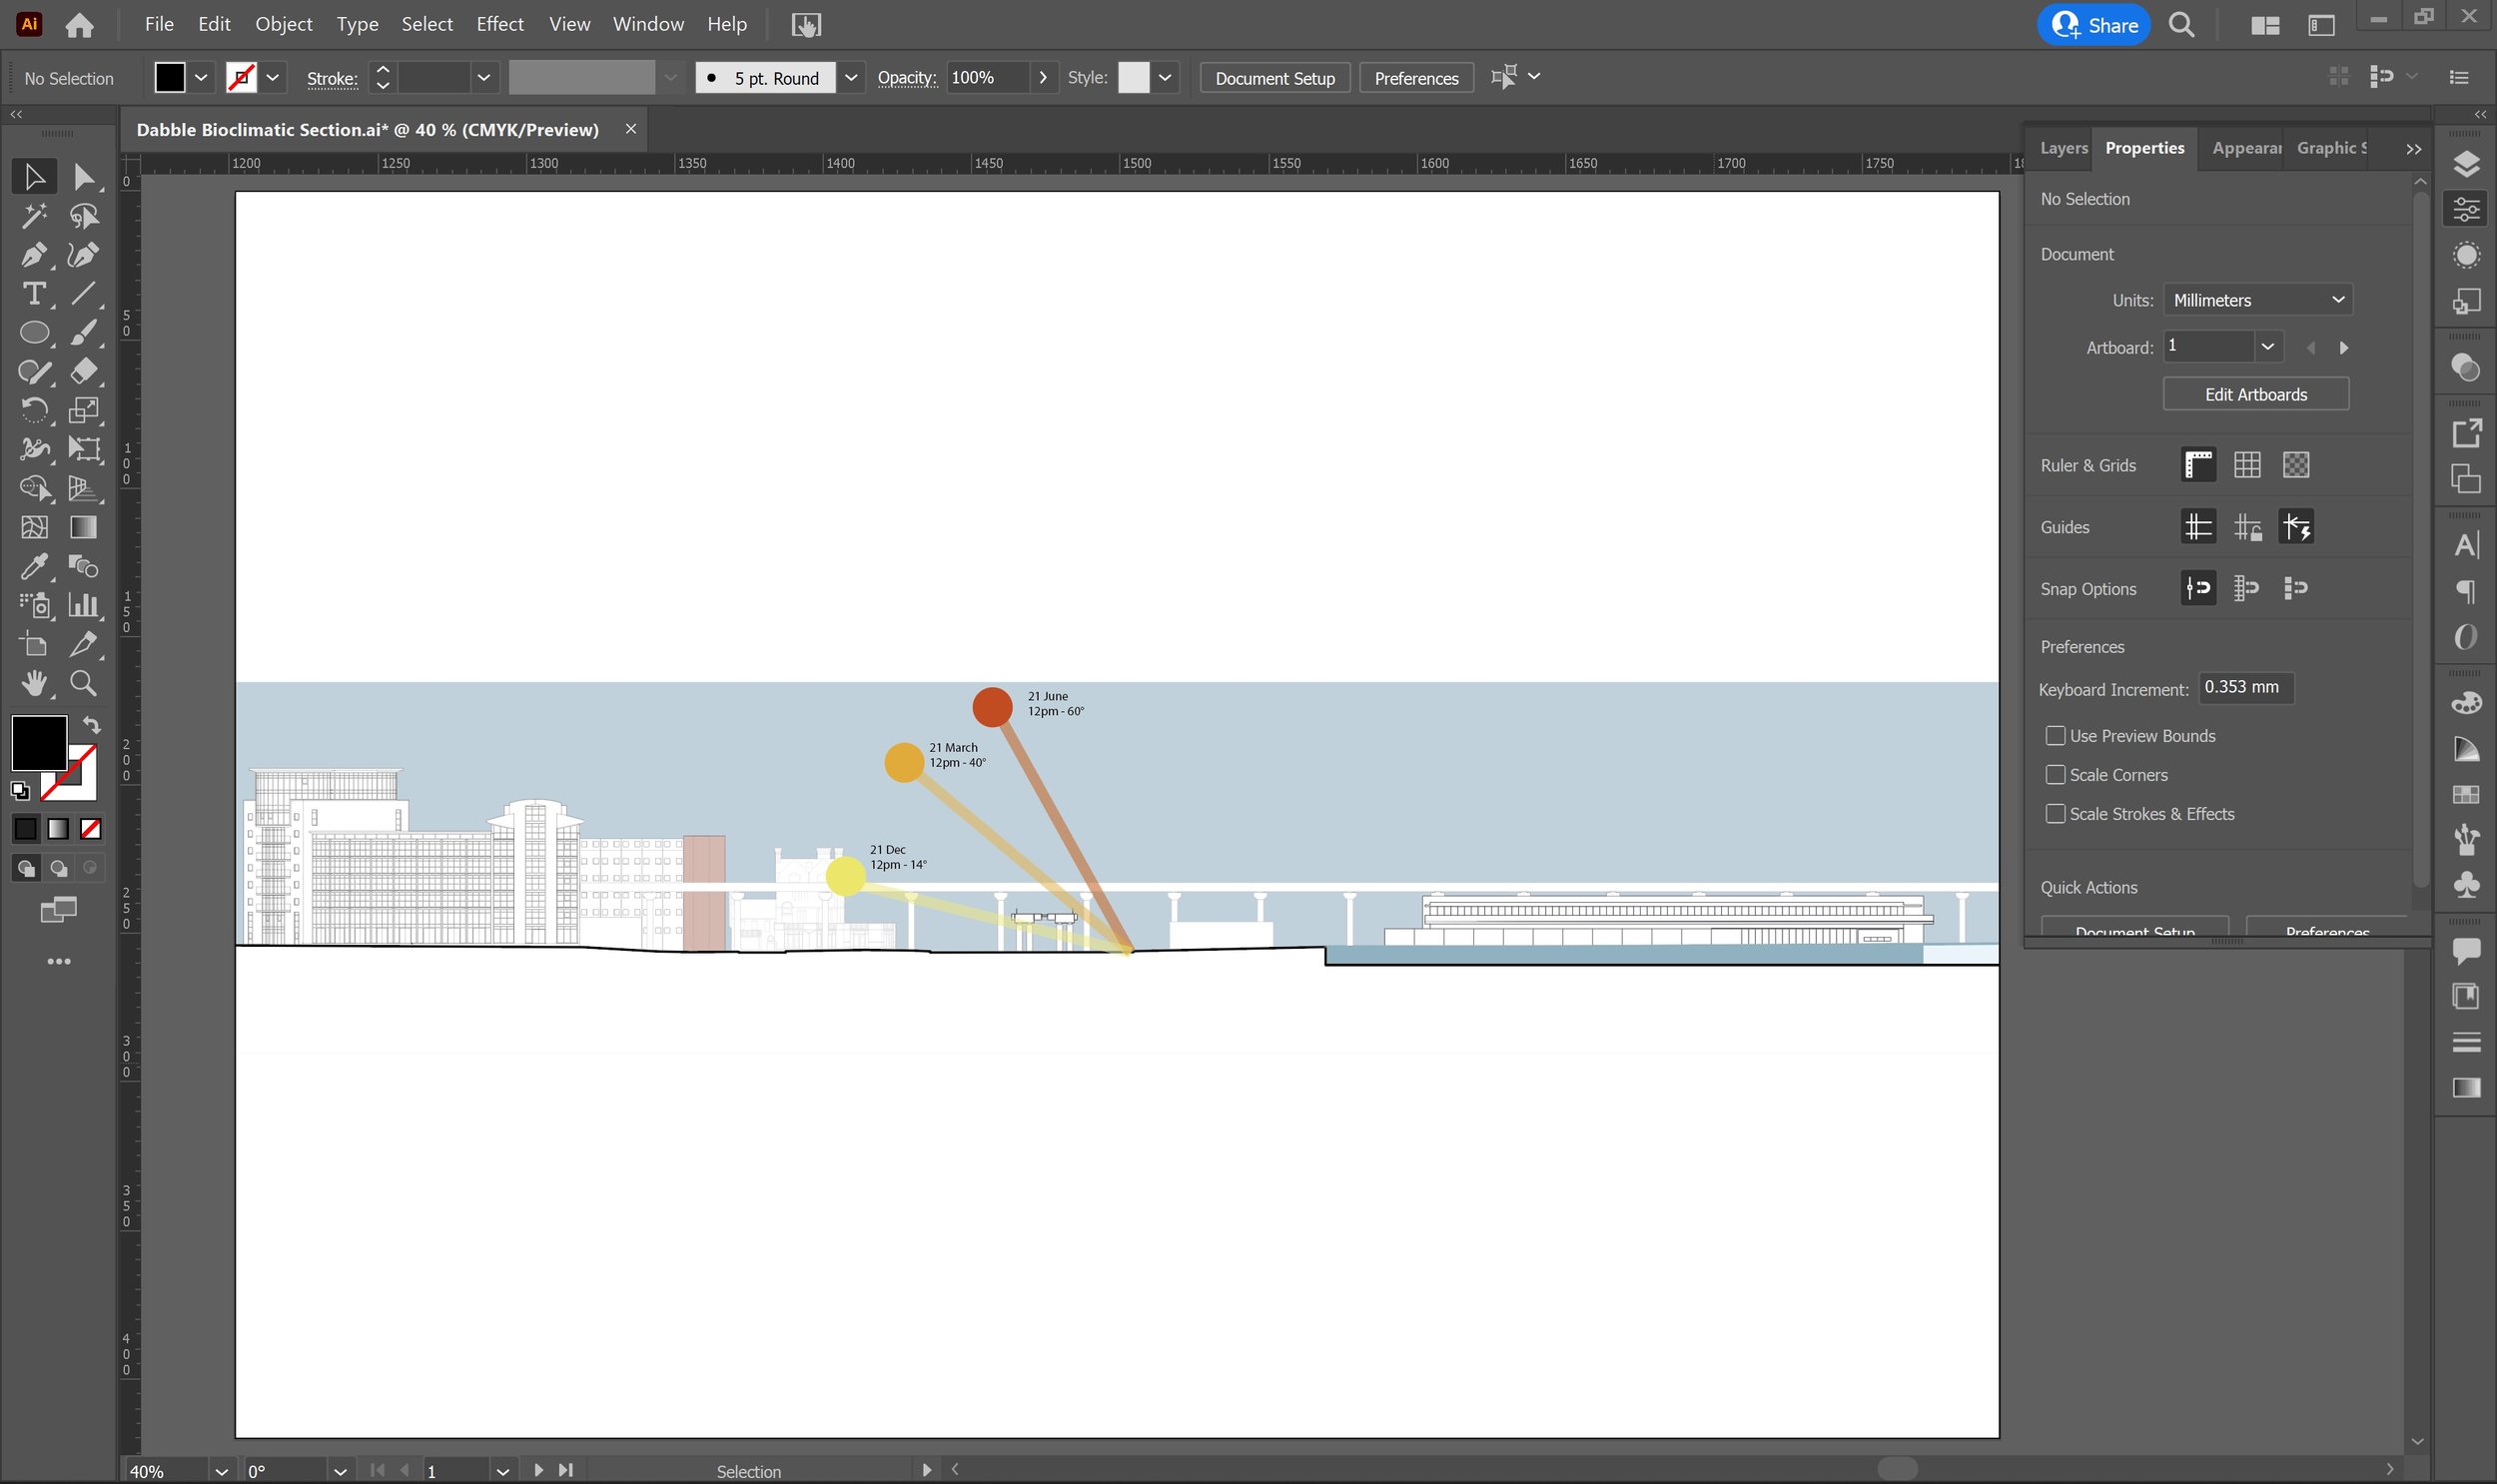
Repeat these last three steps for each sun position you want on your drawing.
Wind
Now, we’re going to represent the different wind patterns on your site. Like the sun path angle, the representation for the wind pattern itself is quite simple, but it’s the data behind this representation that takes time to obtain, analyse and understand.
There are different aspects of the wind conditions you can represent on your section. Wind direction and wind speed are the main aspects you want to convey, which will later inform air flow and circulation for natural ventilation opportunities in your design. Here are the primary wind conditions you want to understand about your site.
If you’re designing in an urban area, you’ll need to look into the wind flows between buildings in your section according to the varying building heights and positions.
[a] Isolated roughness flow, [b] wake interference flow and [c] skimming flow are common examples of wind patterns that can be represented in your drawing. References online on wind patterns as well as books can help you work these out and understand the wind flow around your site. More complex wind flow patterns discovered by first-hand collected data (hand-held anemometers are often used to collect physical wind data on site through spot measurements) or a CFD (Computational Fluid Dynamics) simulation can also be represented in your section.
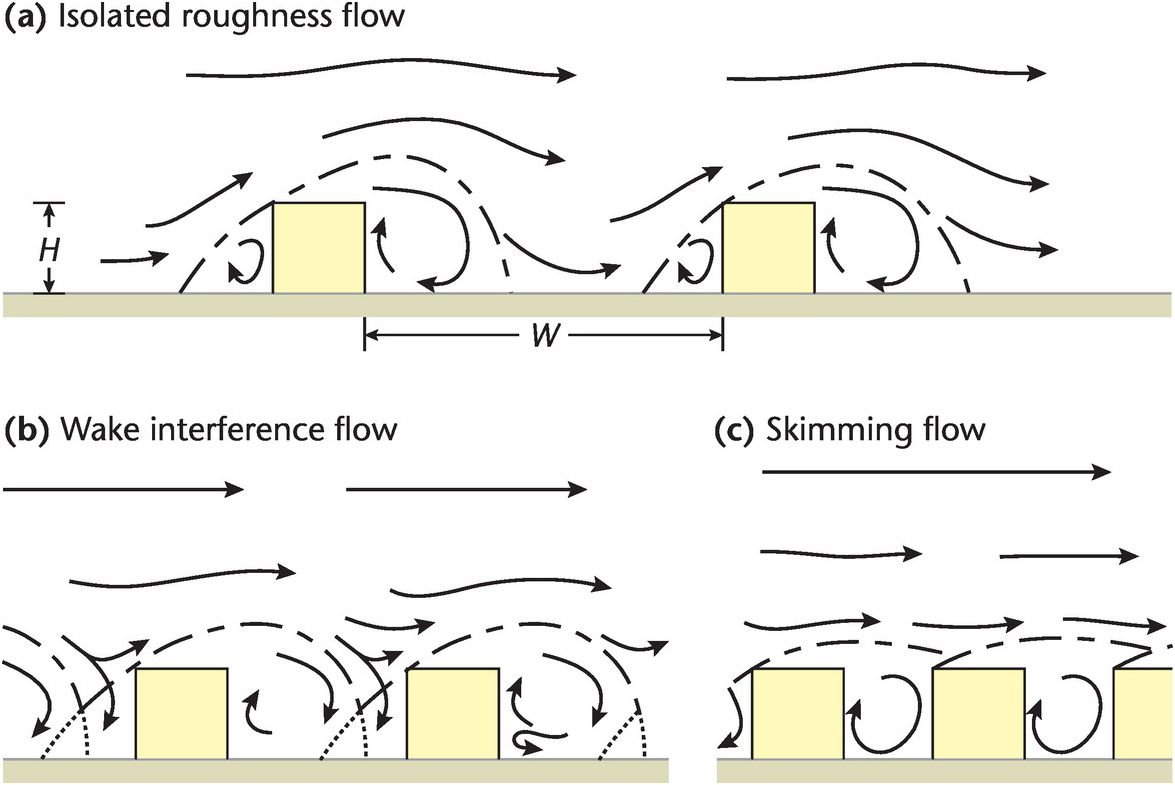
[Image provided by Cambridge University Press]
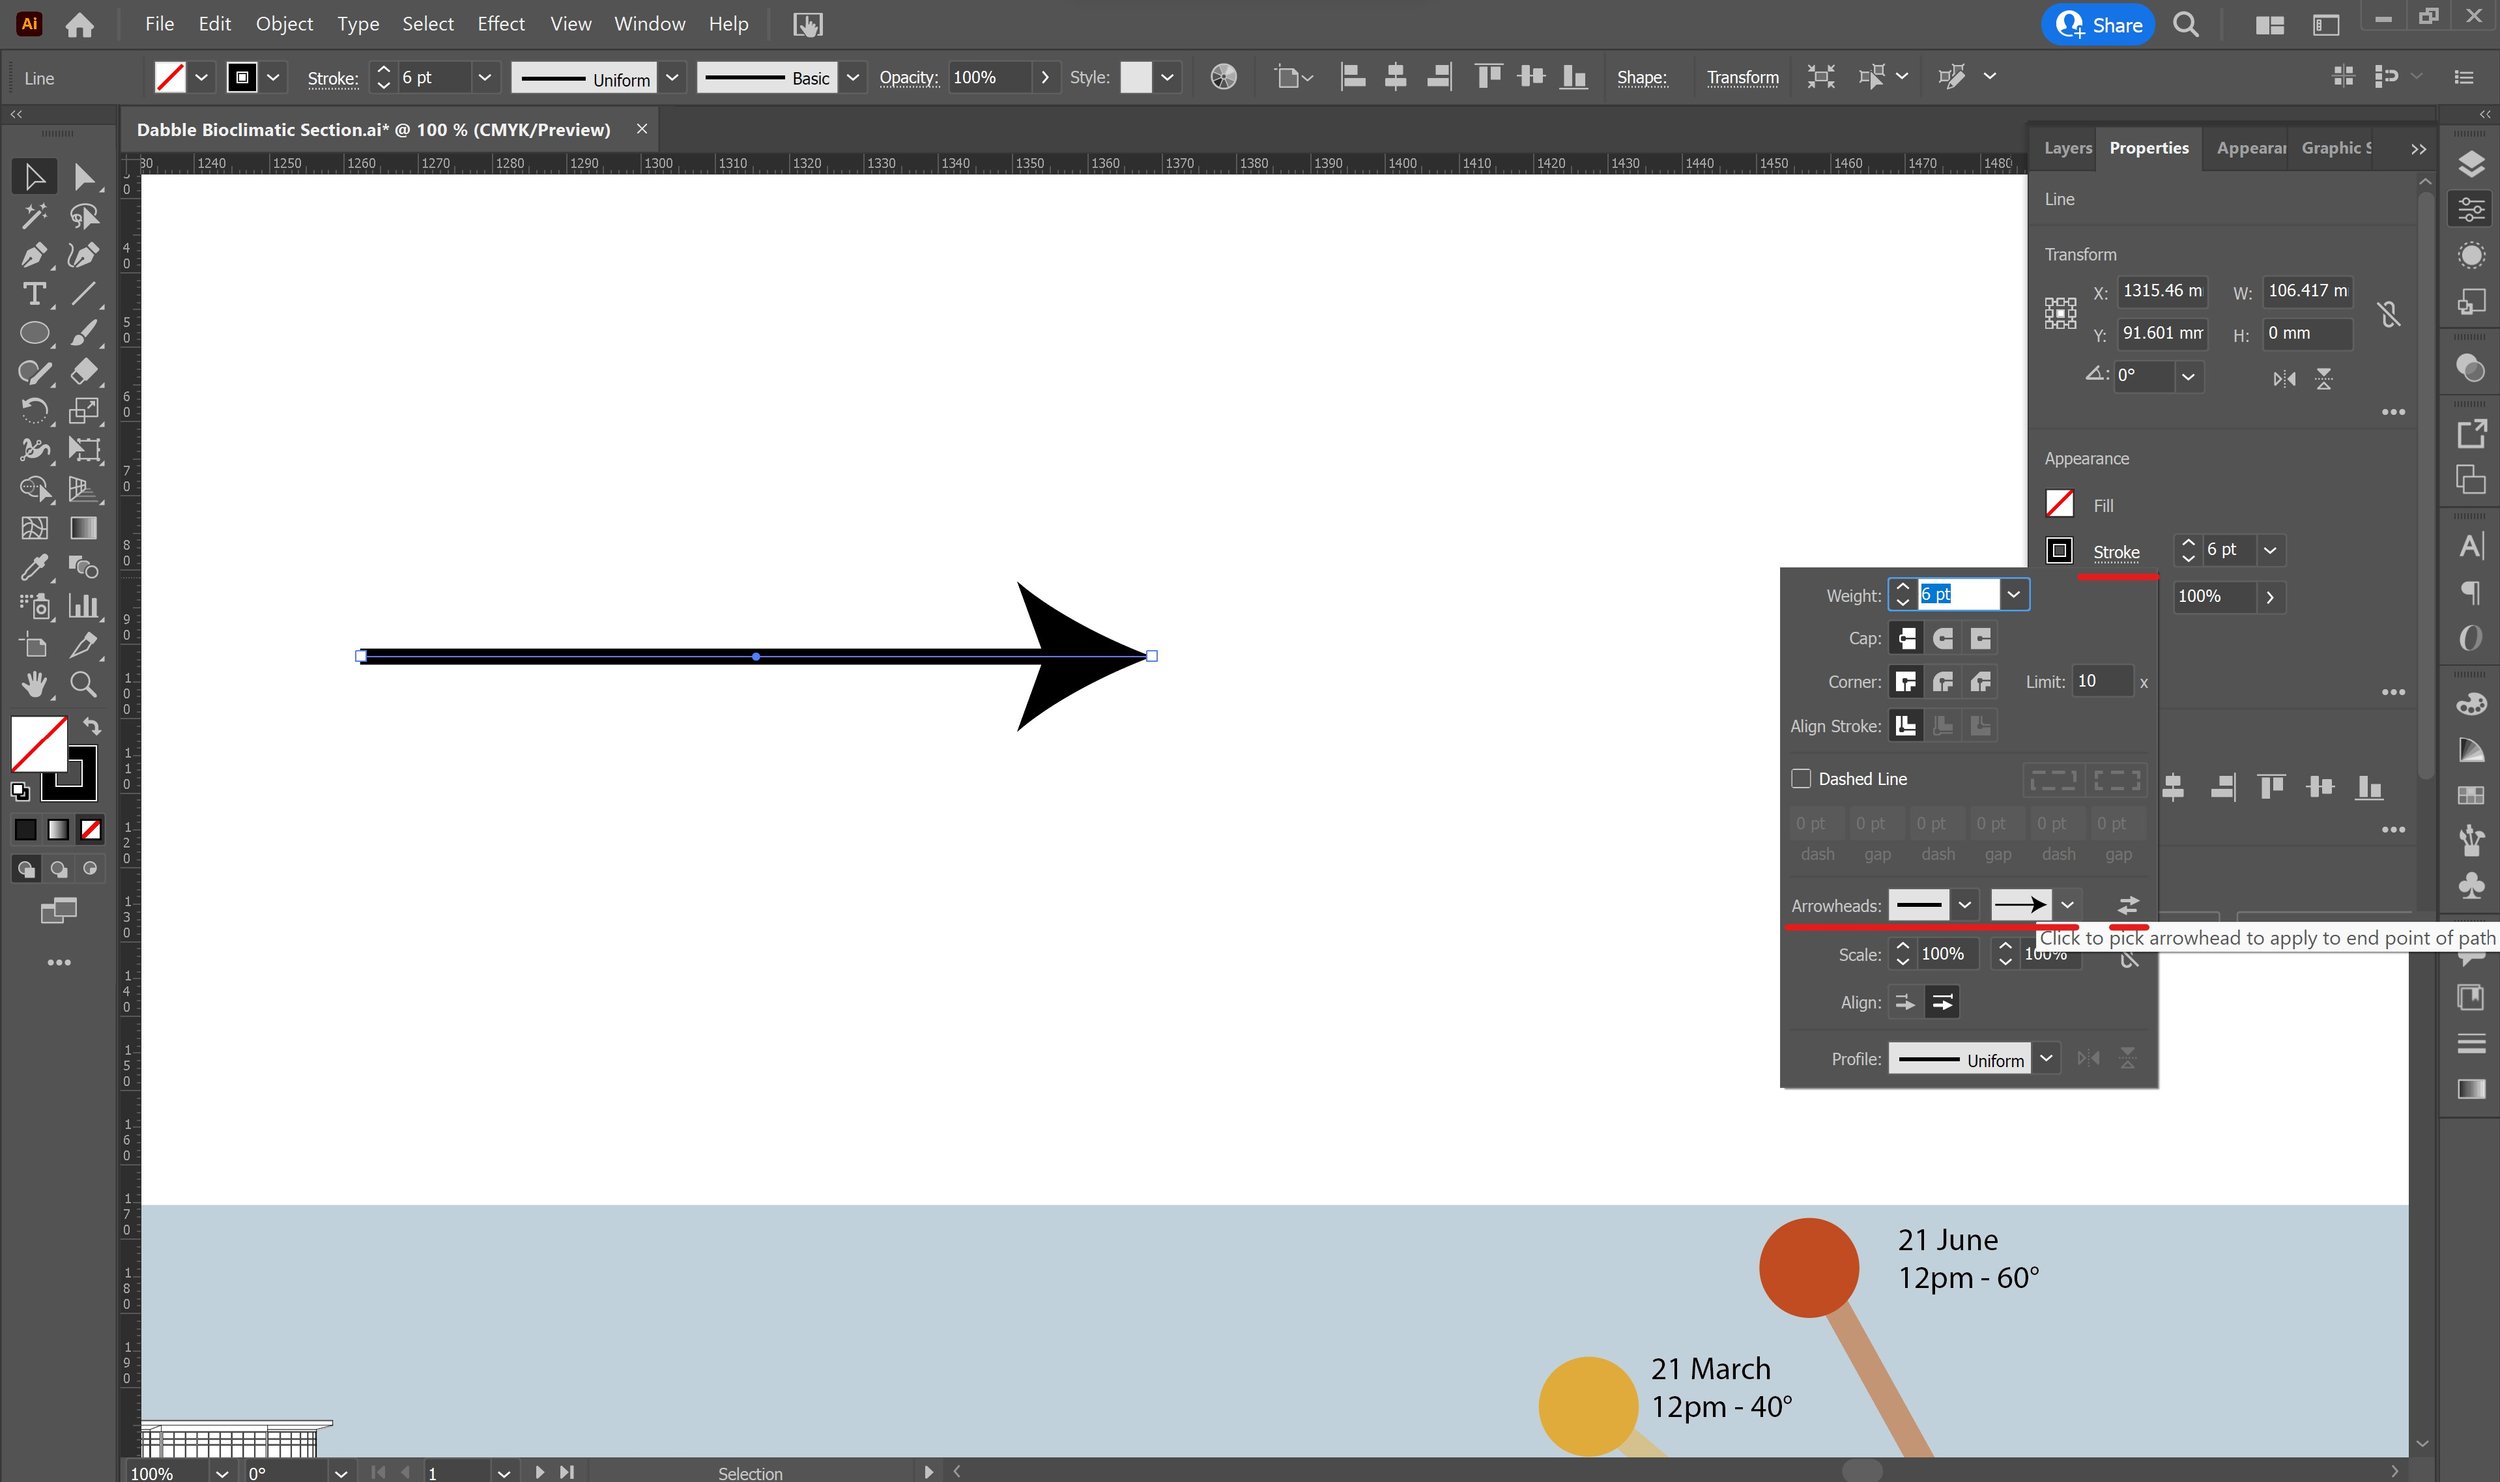
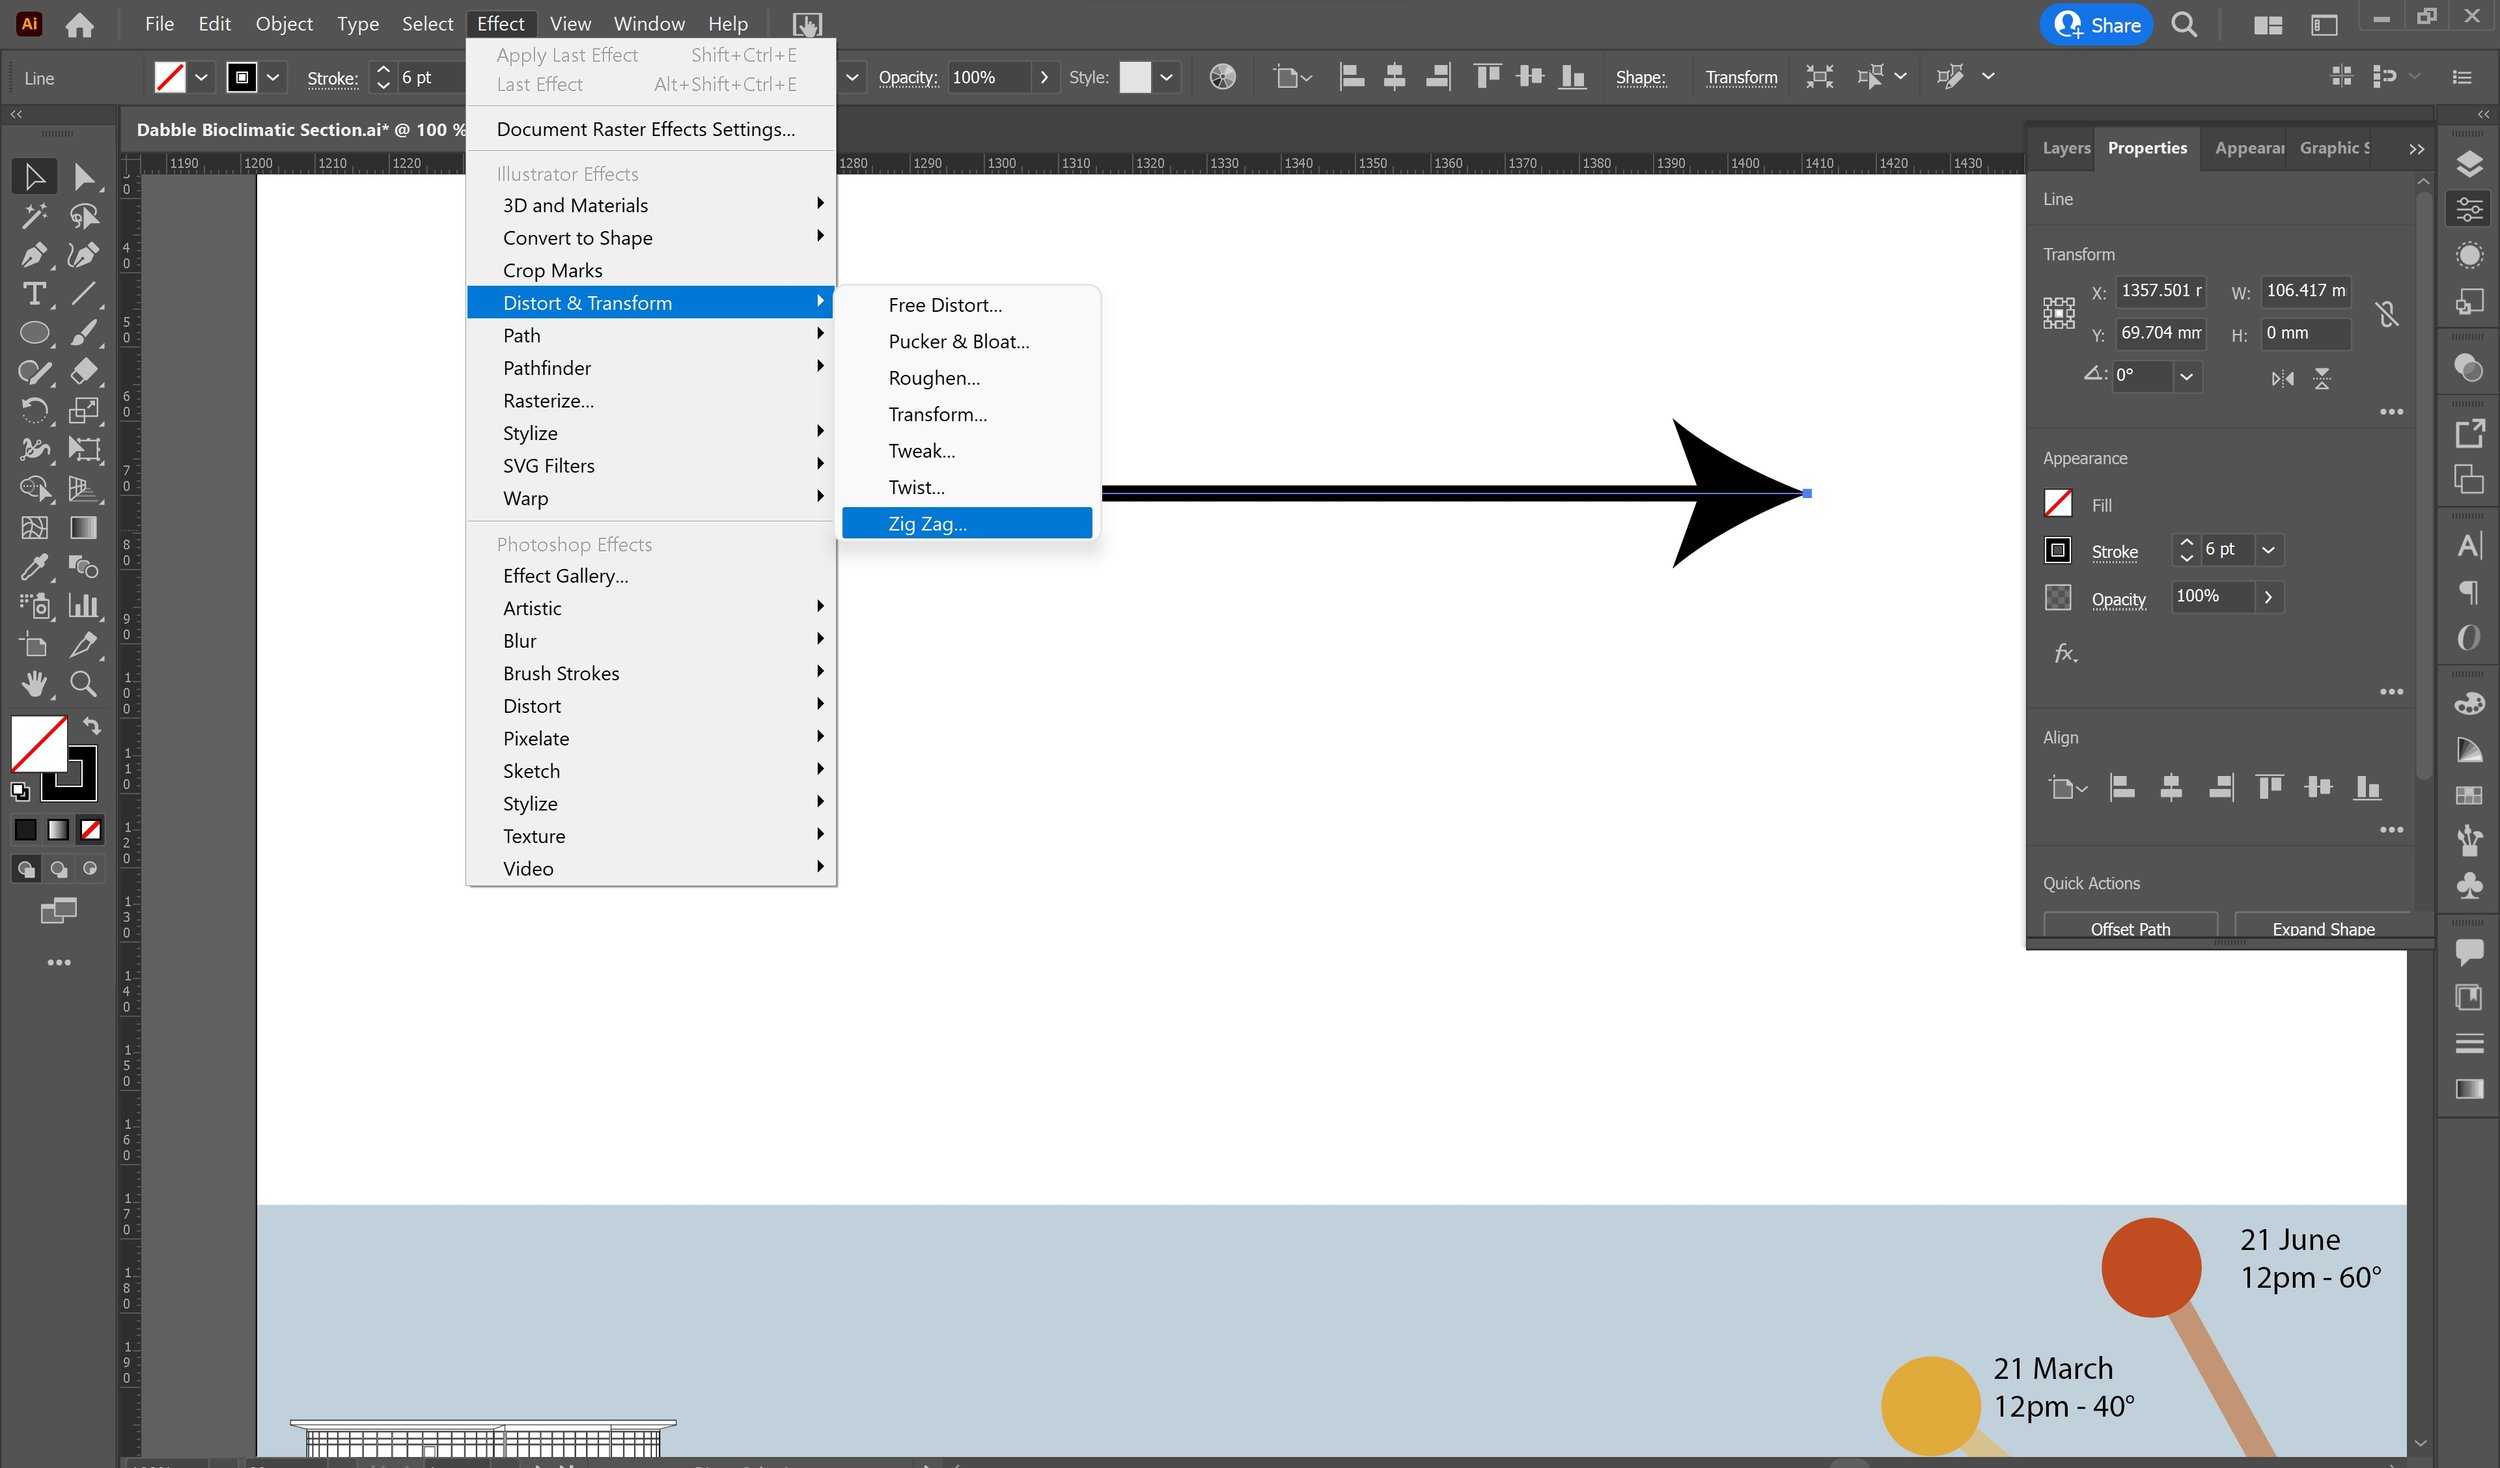
[1] To make an arrow, draw another line using the pen tool or line tool in Illustrator. Go to the ‘Properties’ panel again and click on ‘Stroke’ which should have a dotted underline. Add an arrowhead by clicking one of the arrow dropdown menus and selecting an arrow type. Use the swap icon to change the arrow direction, and play around with the scale of the arrowhead as well as the stroke weight to convey different wind speeds.
[2] To make a wavy arrow, select the current arrow and go to Effects > Distort & Transform > Zig-zag.
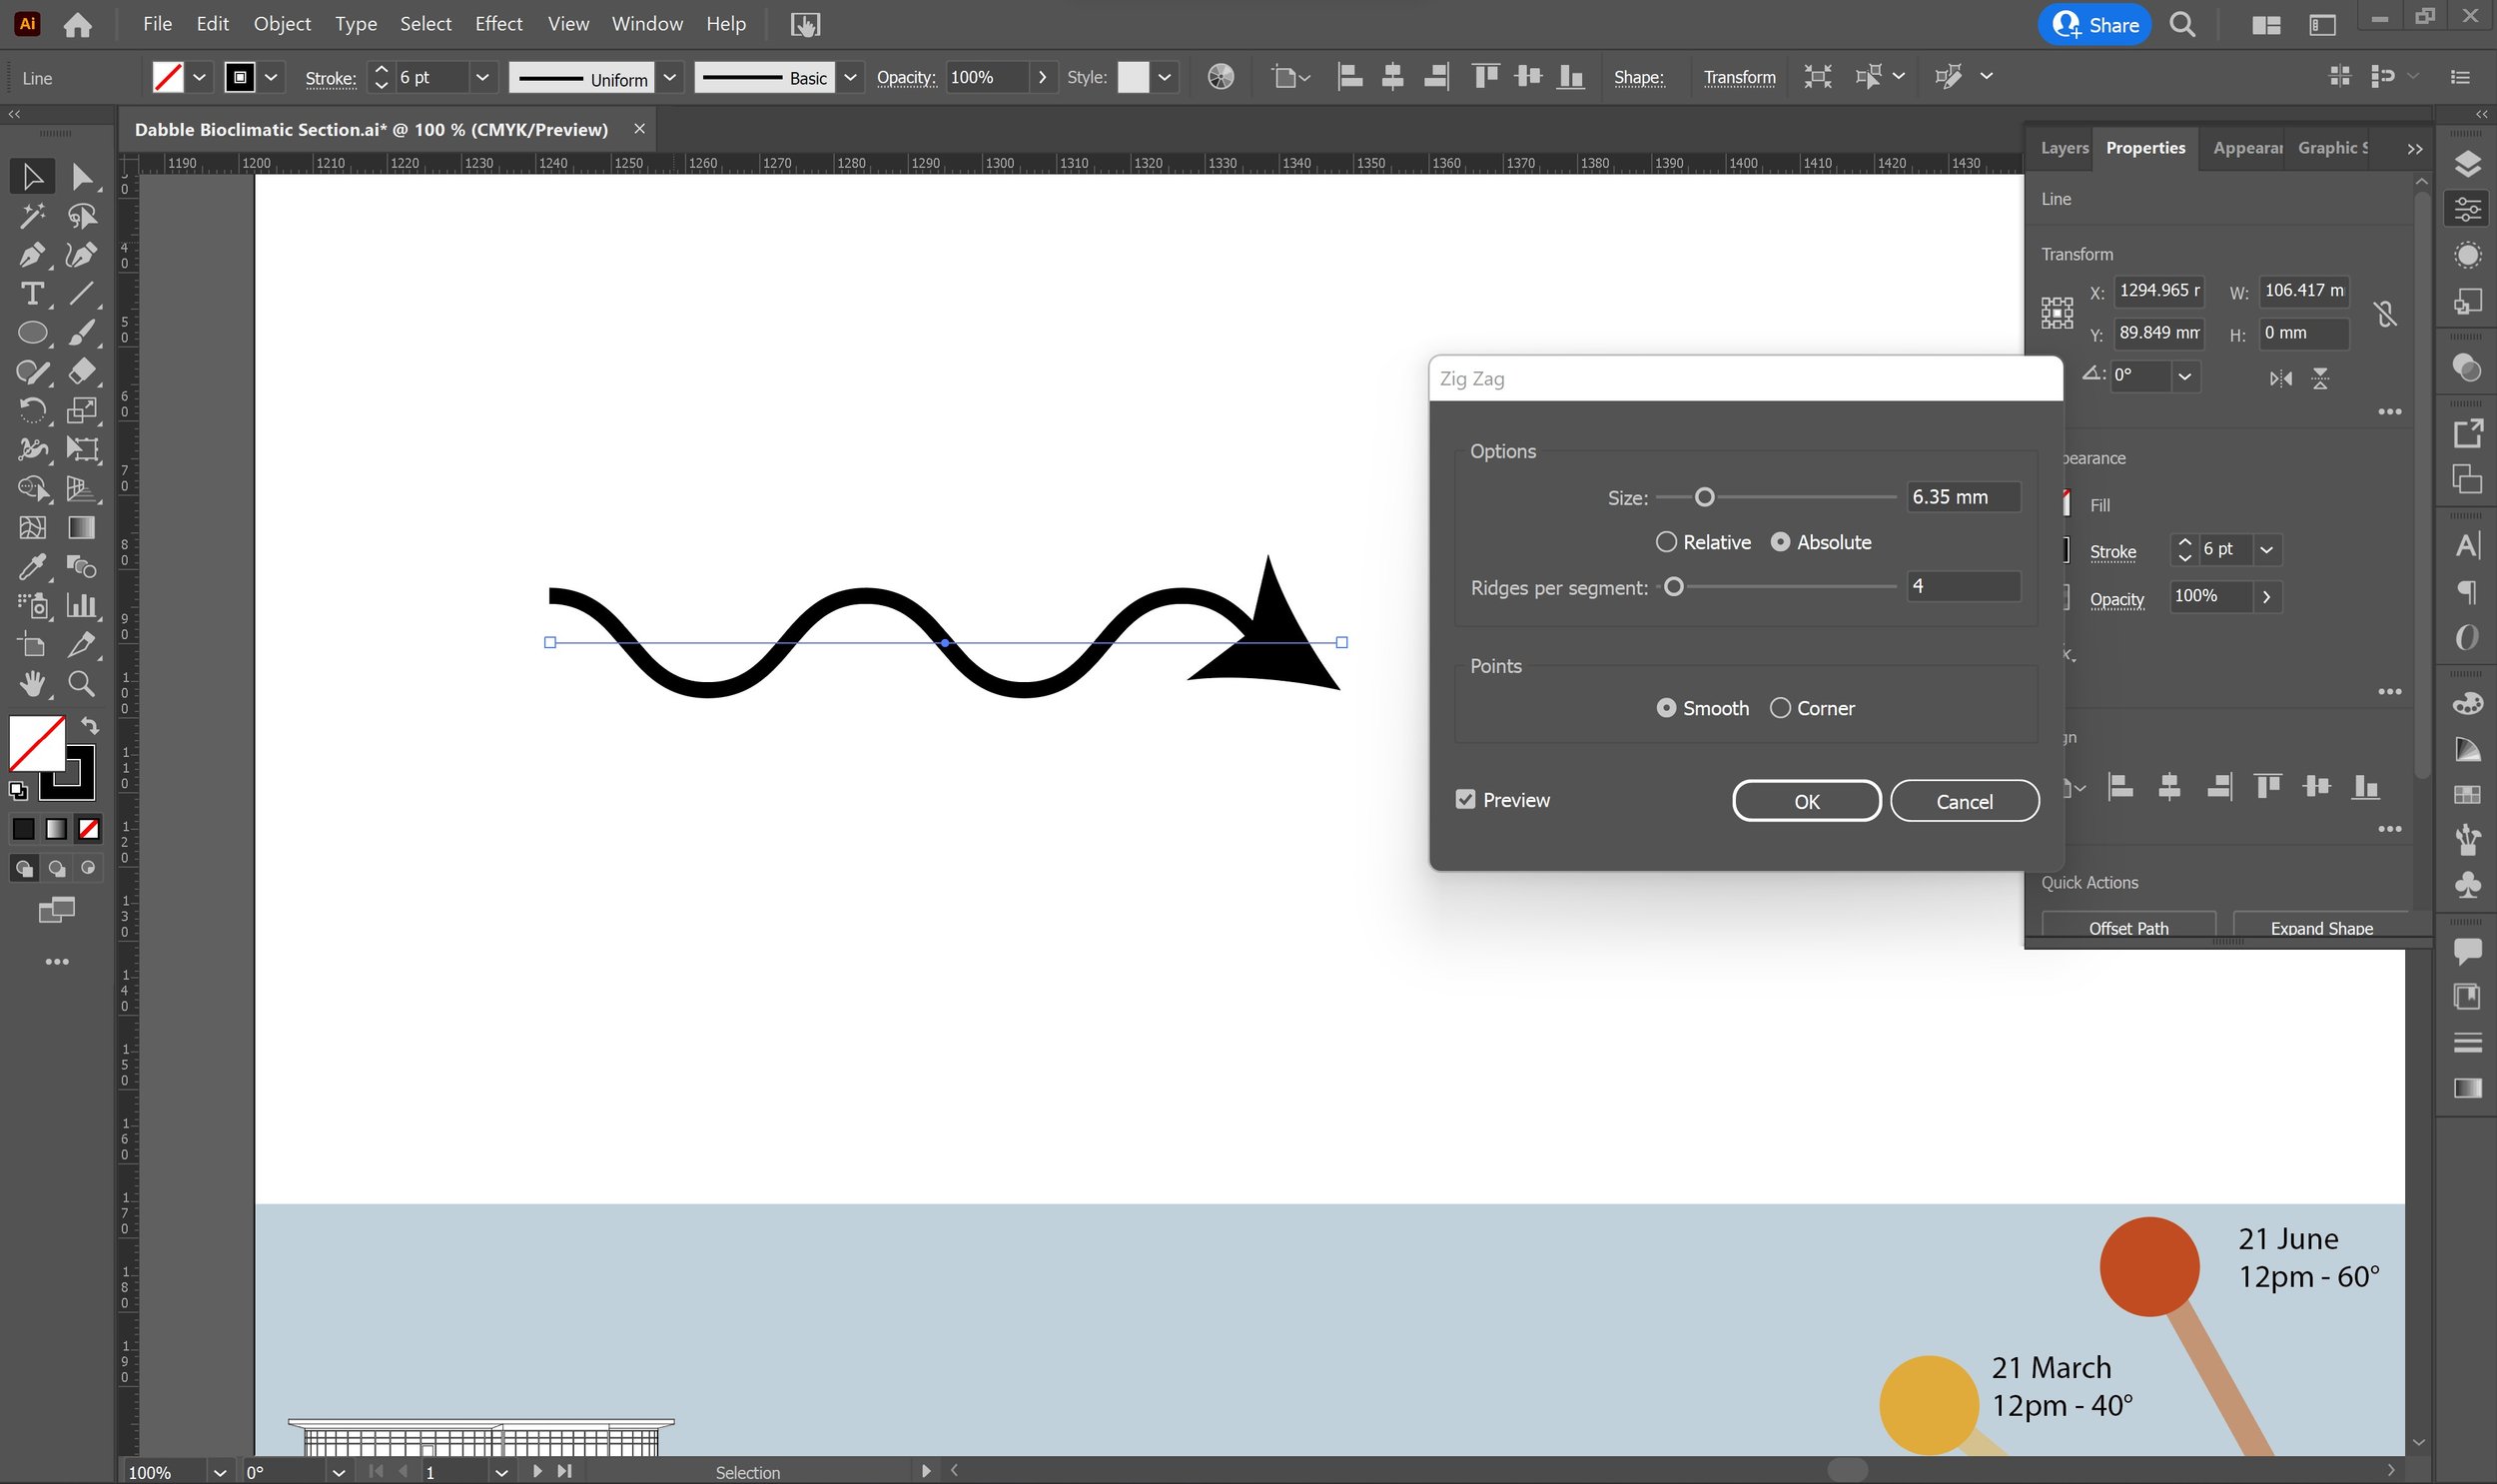
[3] Increase the size to make the waves more extreme, and increase the ‘Ridges per segment’ to add more waves in the same length of the arrow. Click ‘Smooth’ to turn the zigzag into rounded waves and select ‘OK’.
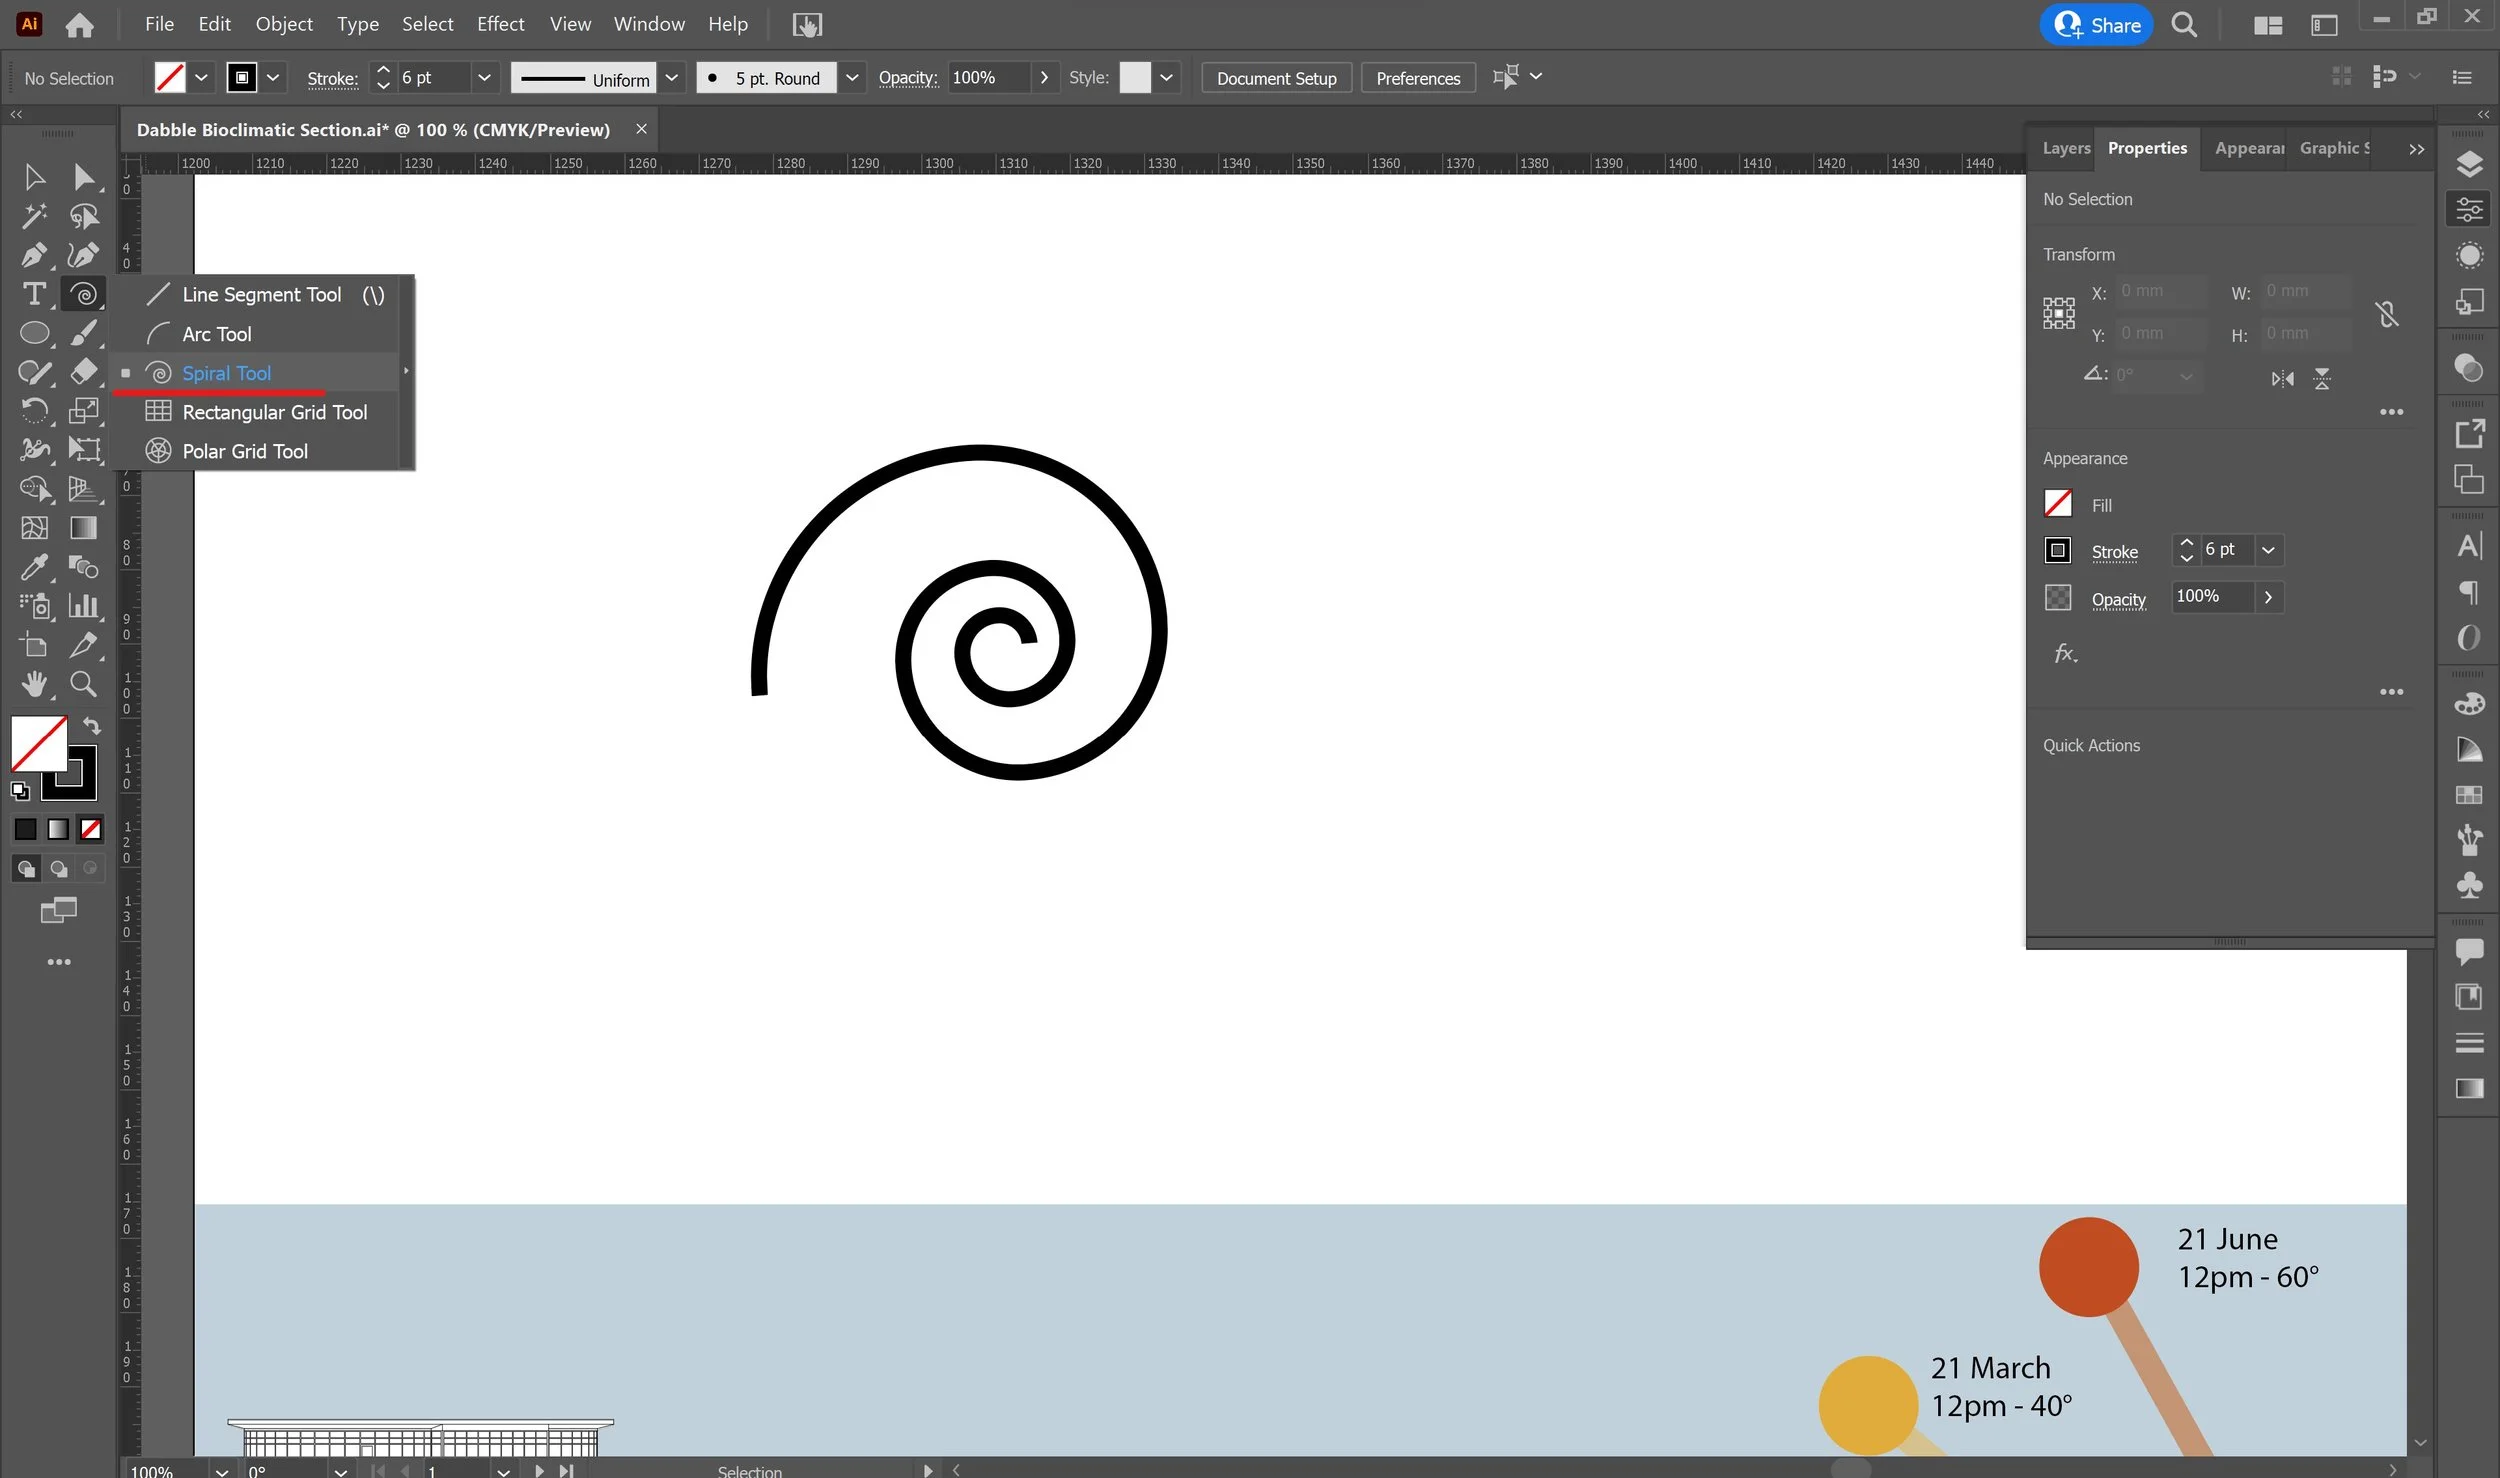
[4] To make a spiral arrow, go to the tool panel on the left hand side of your workspace and right-click on the line tool. Select the ‘Spiral‘ tool, click anywhere on your workspace and drag outwards to draw the spiral. Use the ‘Direct Selection’ tool (keyboard shortcut ‘A’) to amend the line after you’ve drawn it.
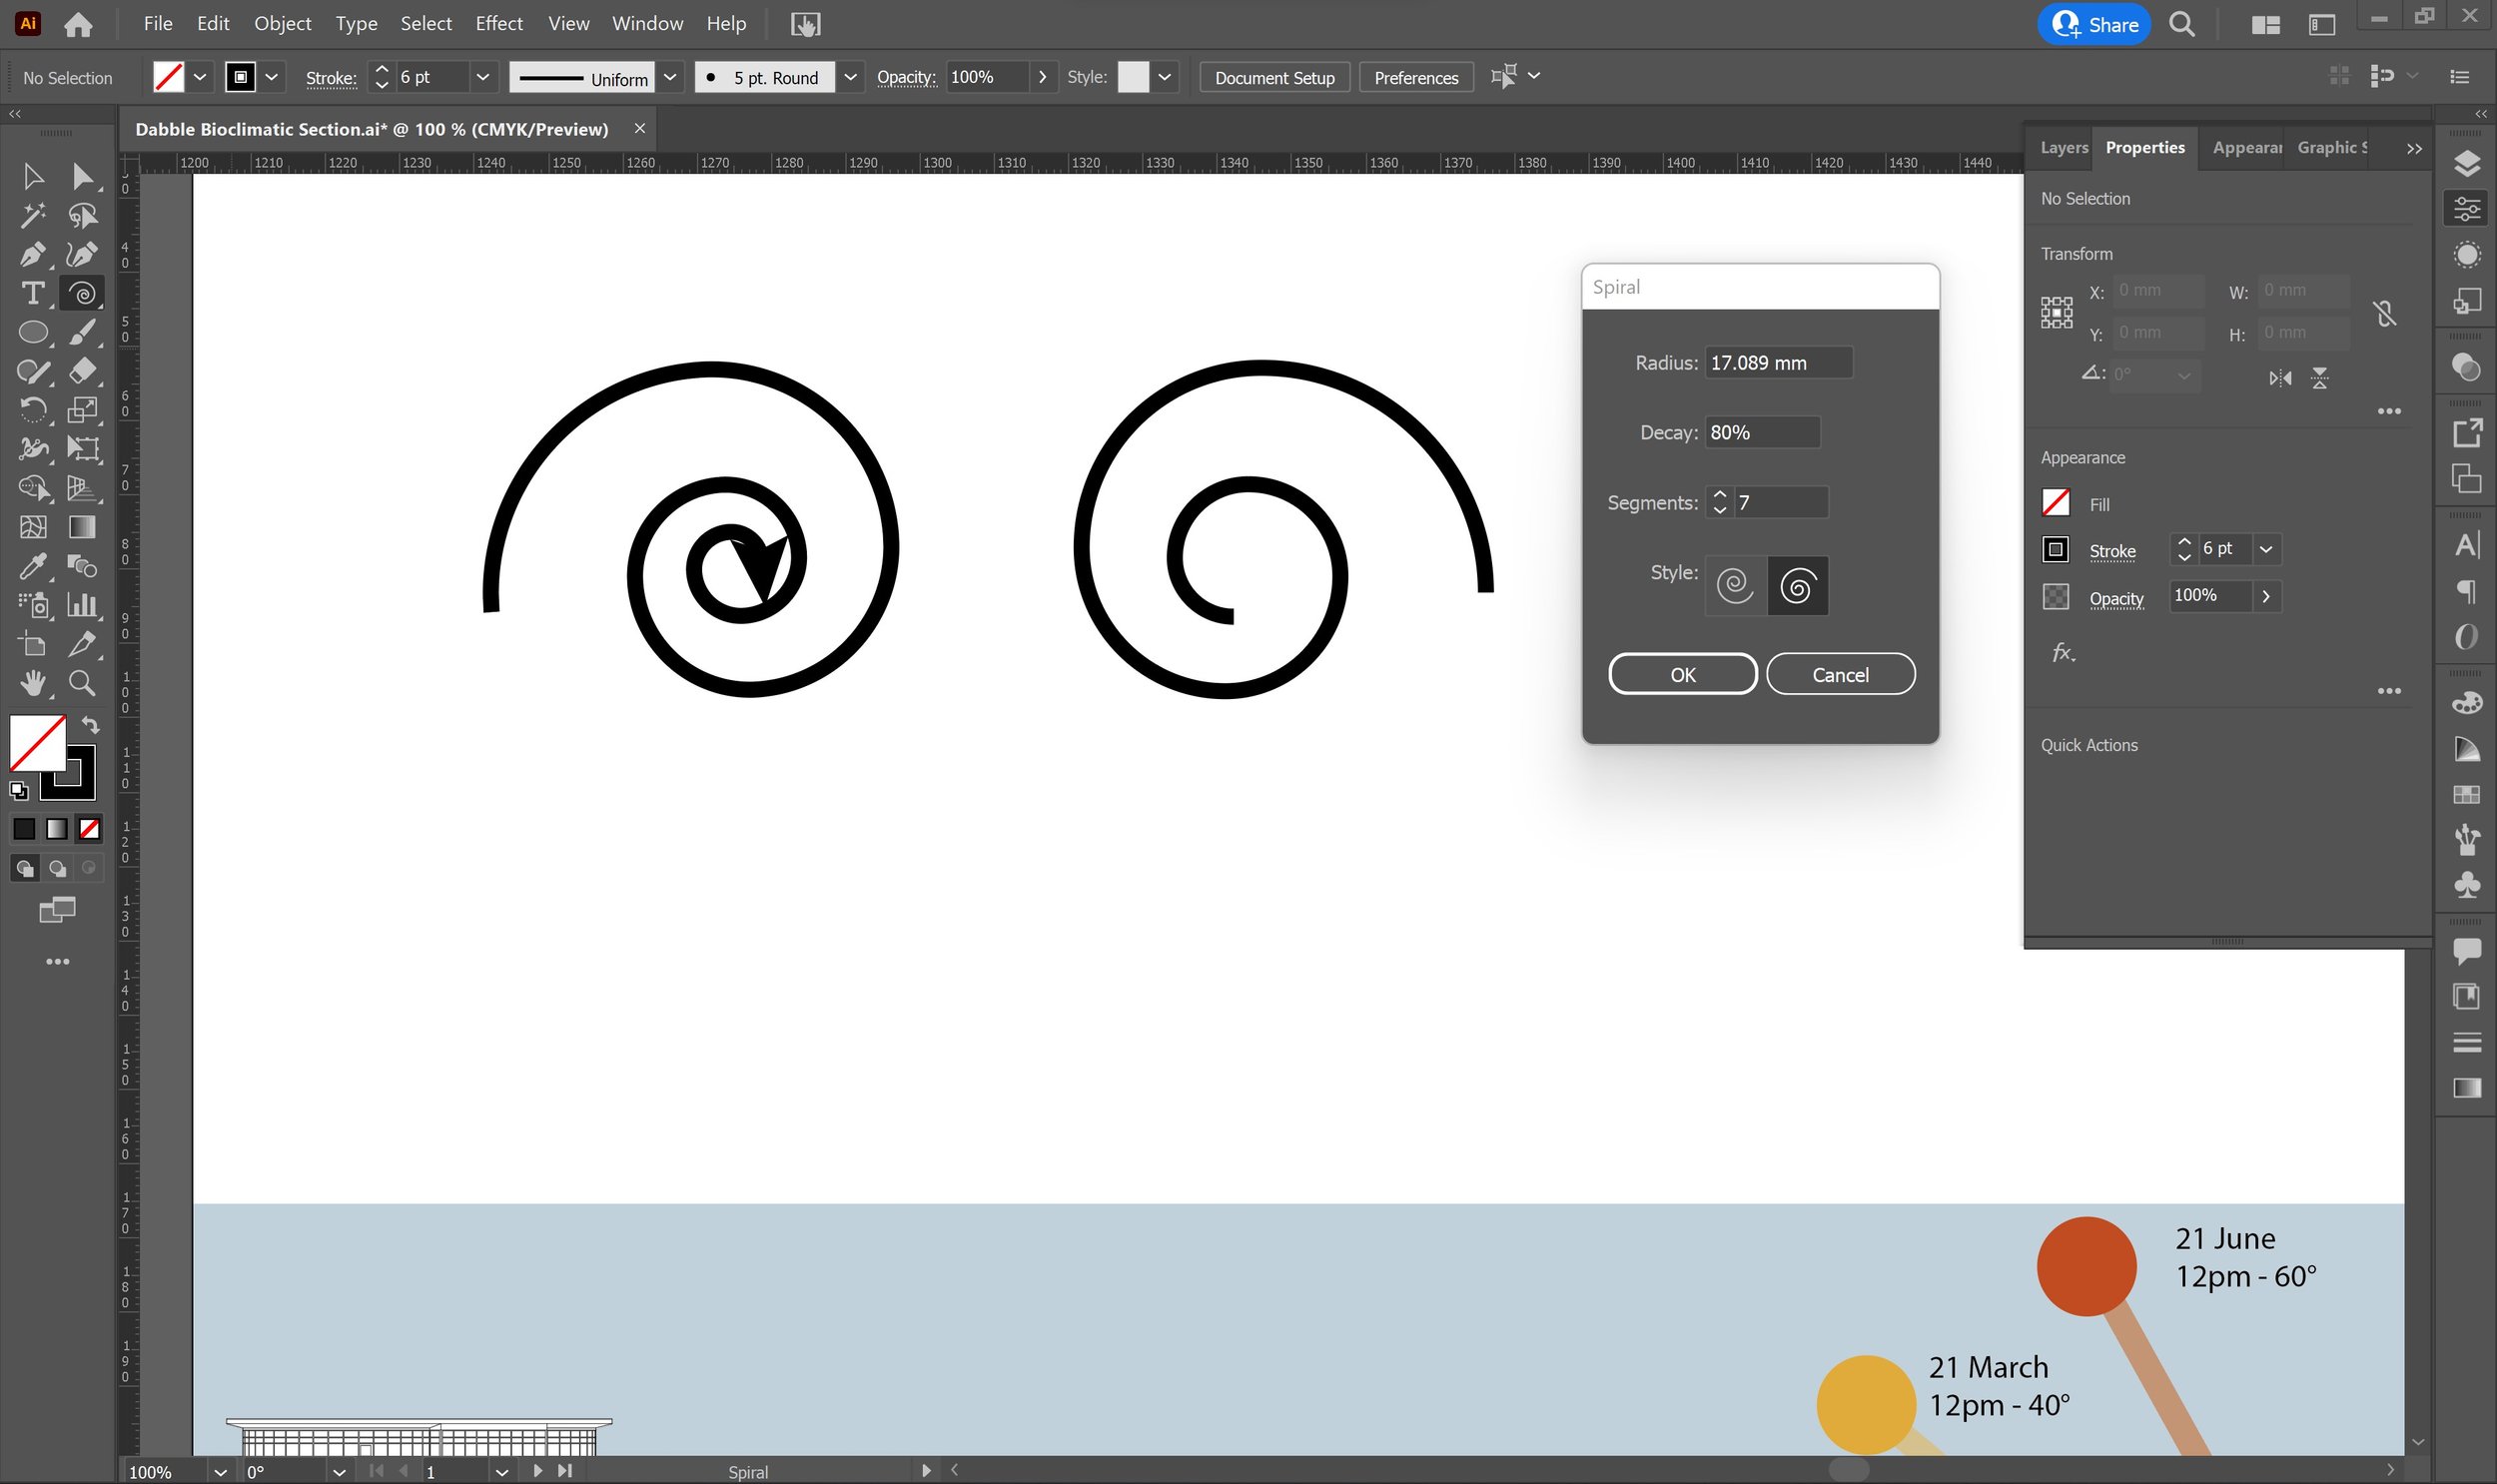
[5] Alternatively, simply click anywhere on your workspace to bring up the dialogue box where you can amend the attributes, such as the radius or number of segments in your spiral (you might want to lower this for wind flow arrows), Again, click ‘OK’ when you’re done to create your new spiral, add the arrowhead in the ‘Stroke’ section and amend as needed.
By combining these different line and arrow features, you should be able to represent different flows and wind patterns on your bioclimatic section on a microclimatic scale.
Air pollution and CO2
Air pollution and CO2 data is usually obtained through on-site spot measurements using air quality metres and handheld CO2 metres, which you can plot on your section. This can be represented by graphically overlaying the data collected onto the section, and including a legend or graph axis on one side of the drawing to quantitatively convey the varying levels of air quality across the site. It’s useful to add the spot measurement locations on a reference plan. The same can be done for temperature and humidity readings. I’ll use CO2 readings as an example for this tutorial.
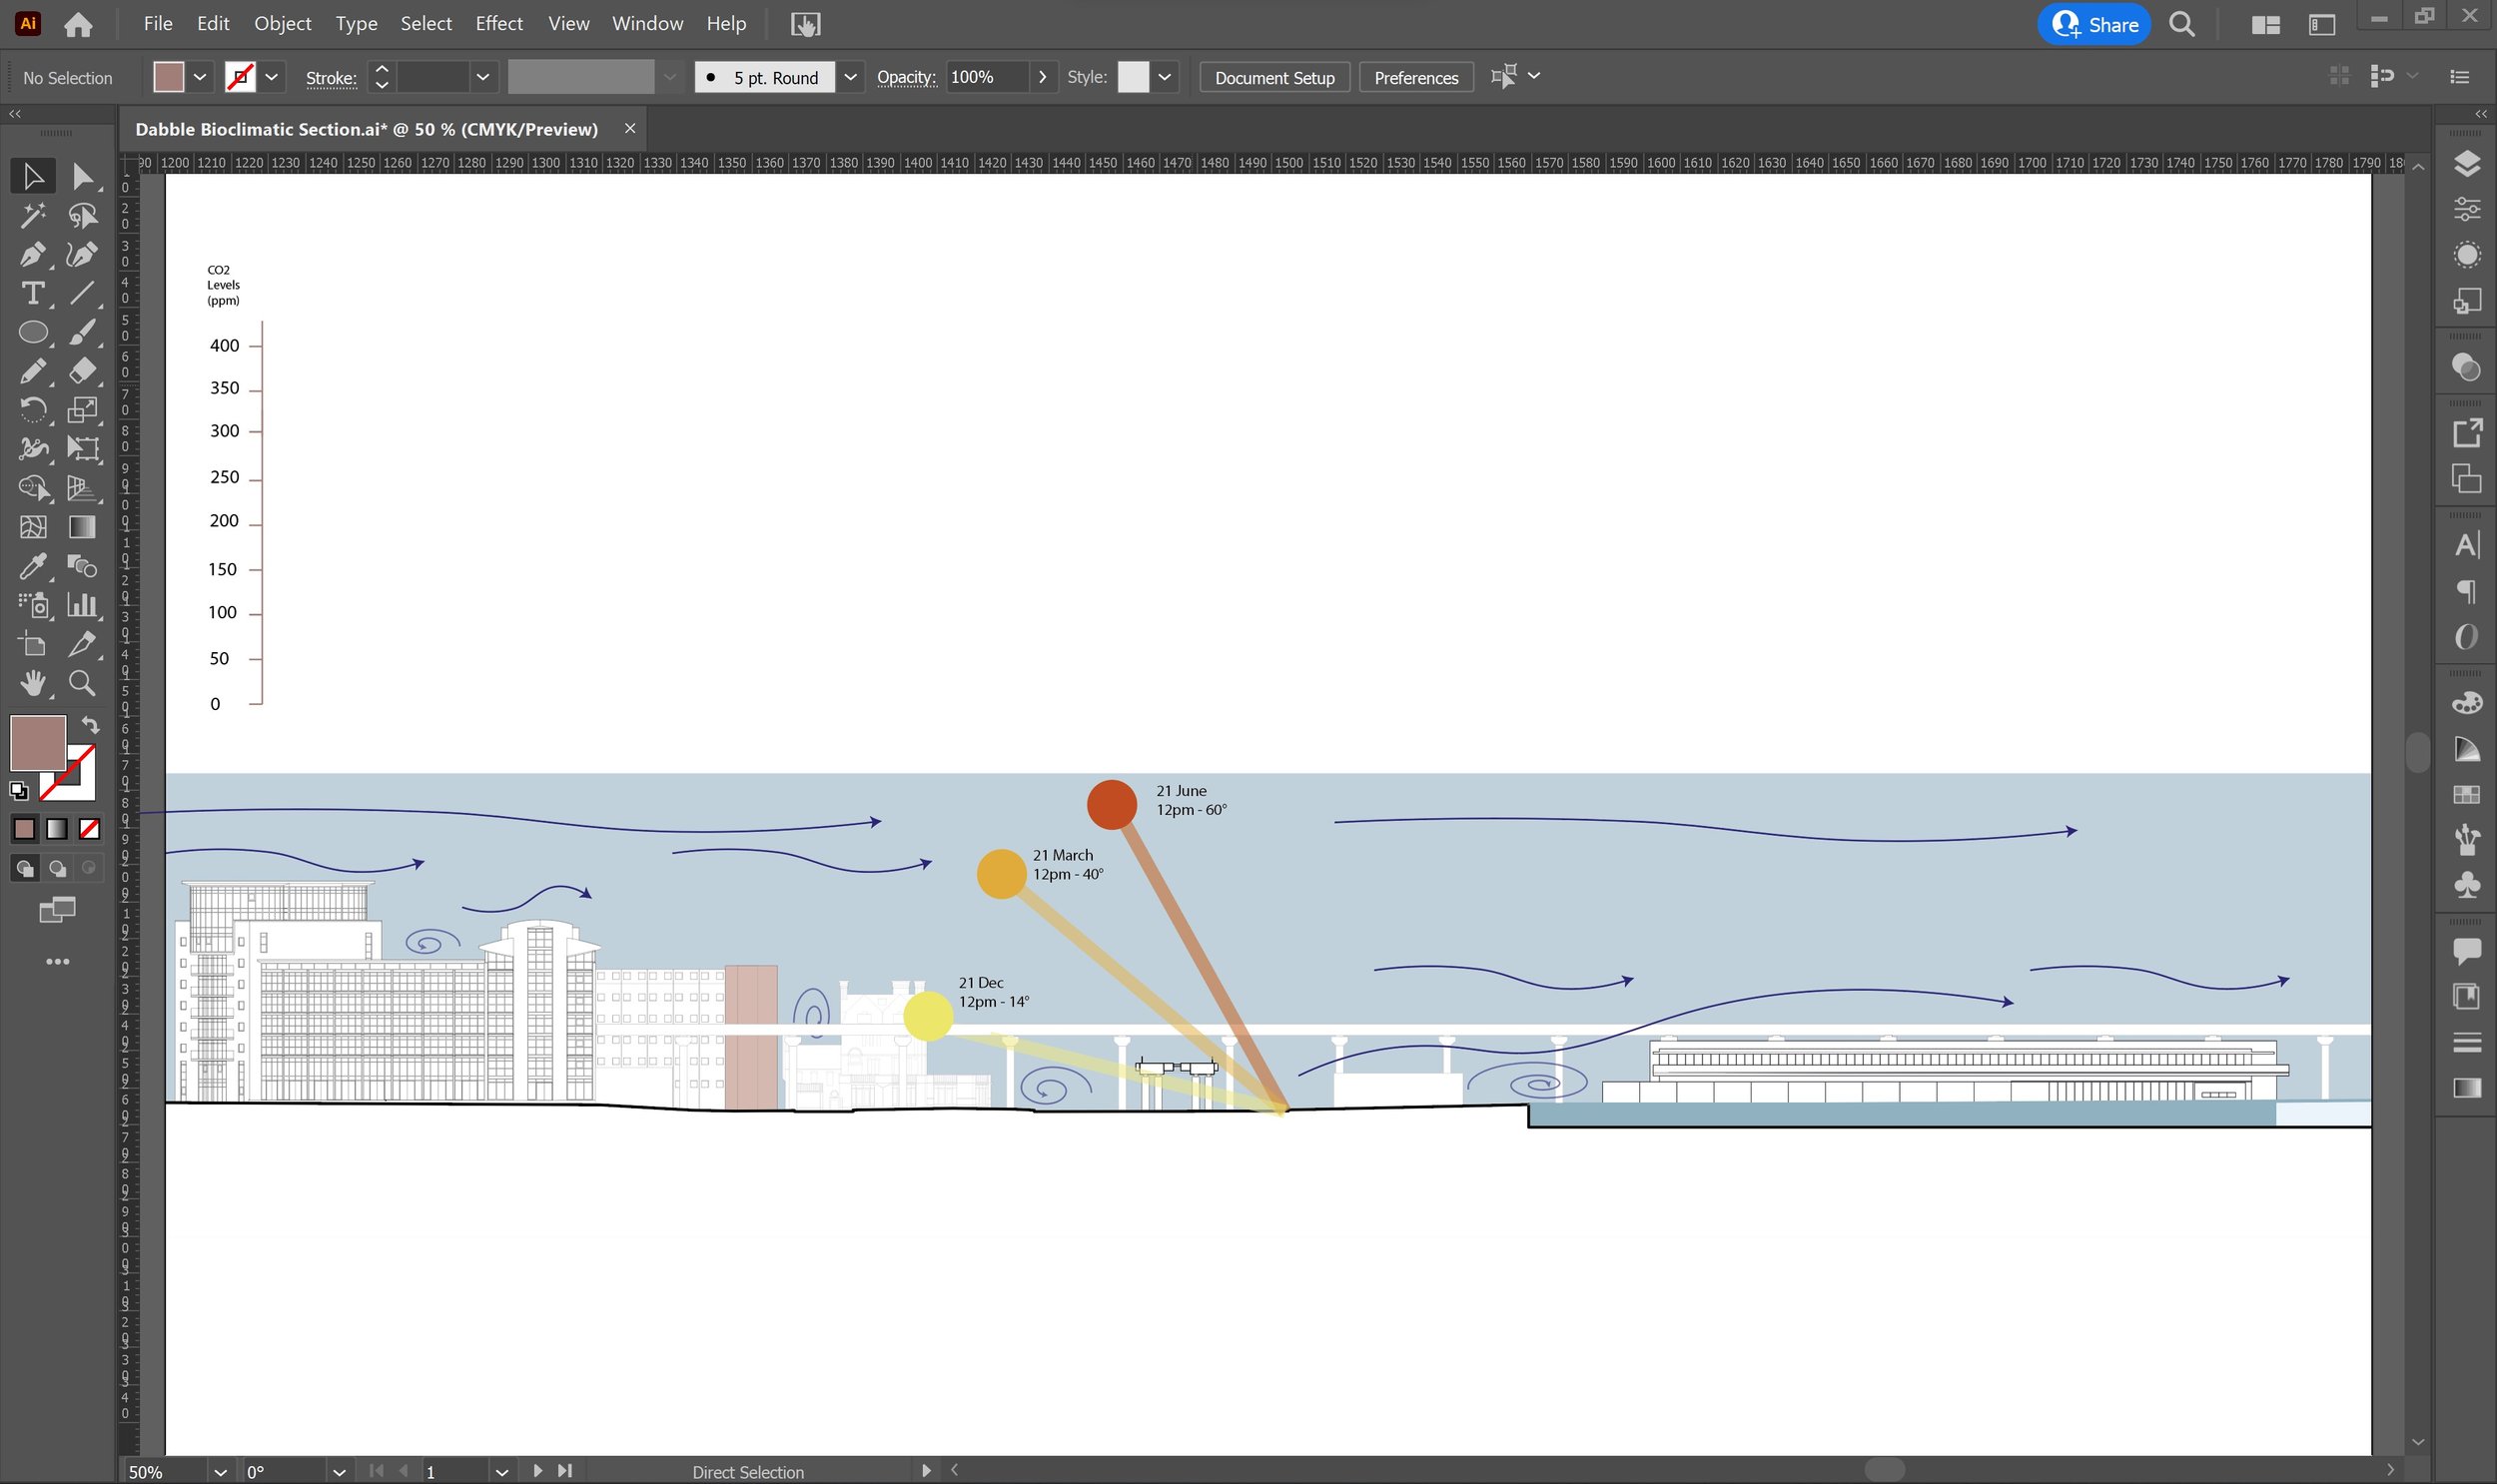
[1] On the left-hand side or above your section (I’ve put this above for this tutorial so it’s clearer), use the pen tool or line tool and draw the y-axis of your CO2 graph according to your highest and lowest pollutant readings. Don’t forget to include the marked unit dividers, name and measurement units.
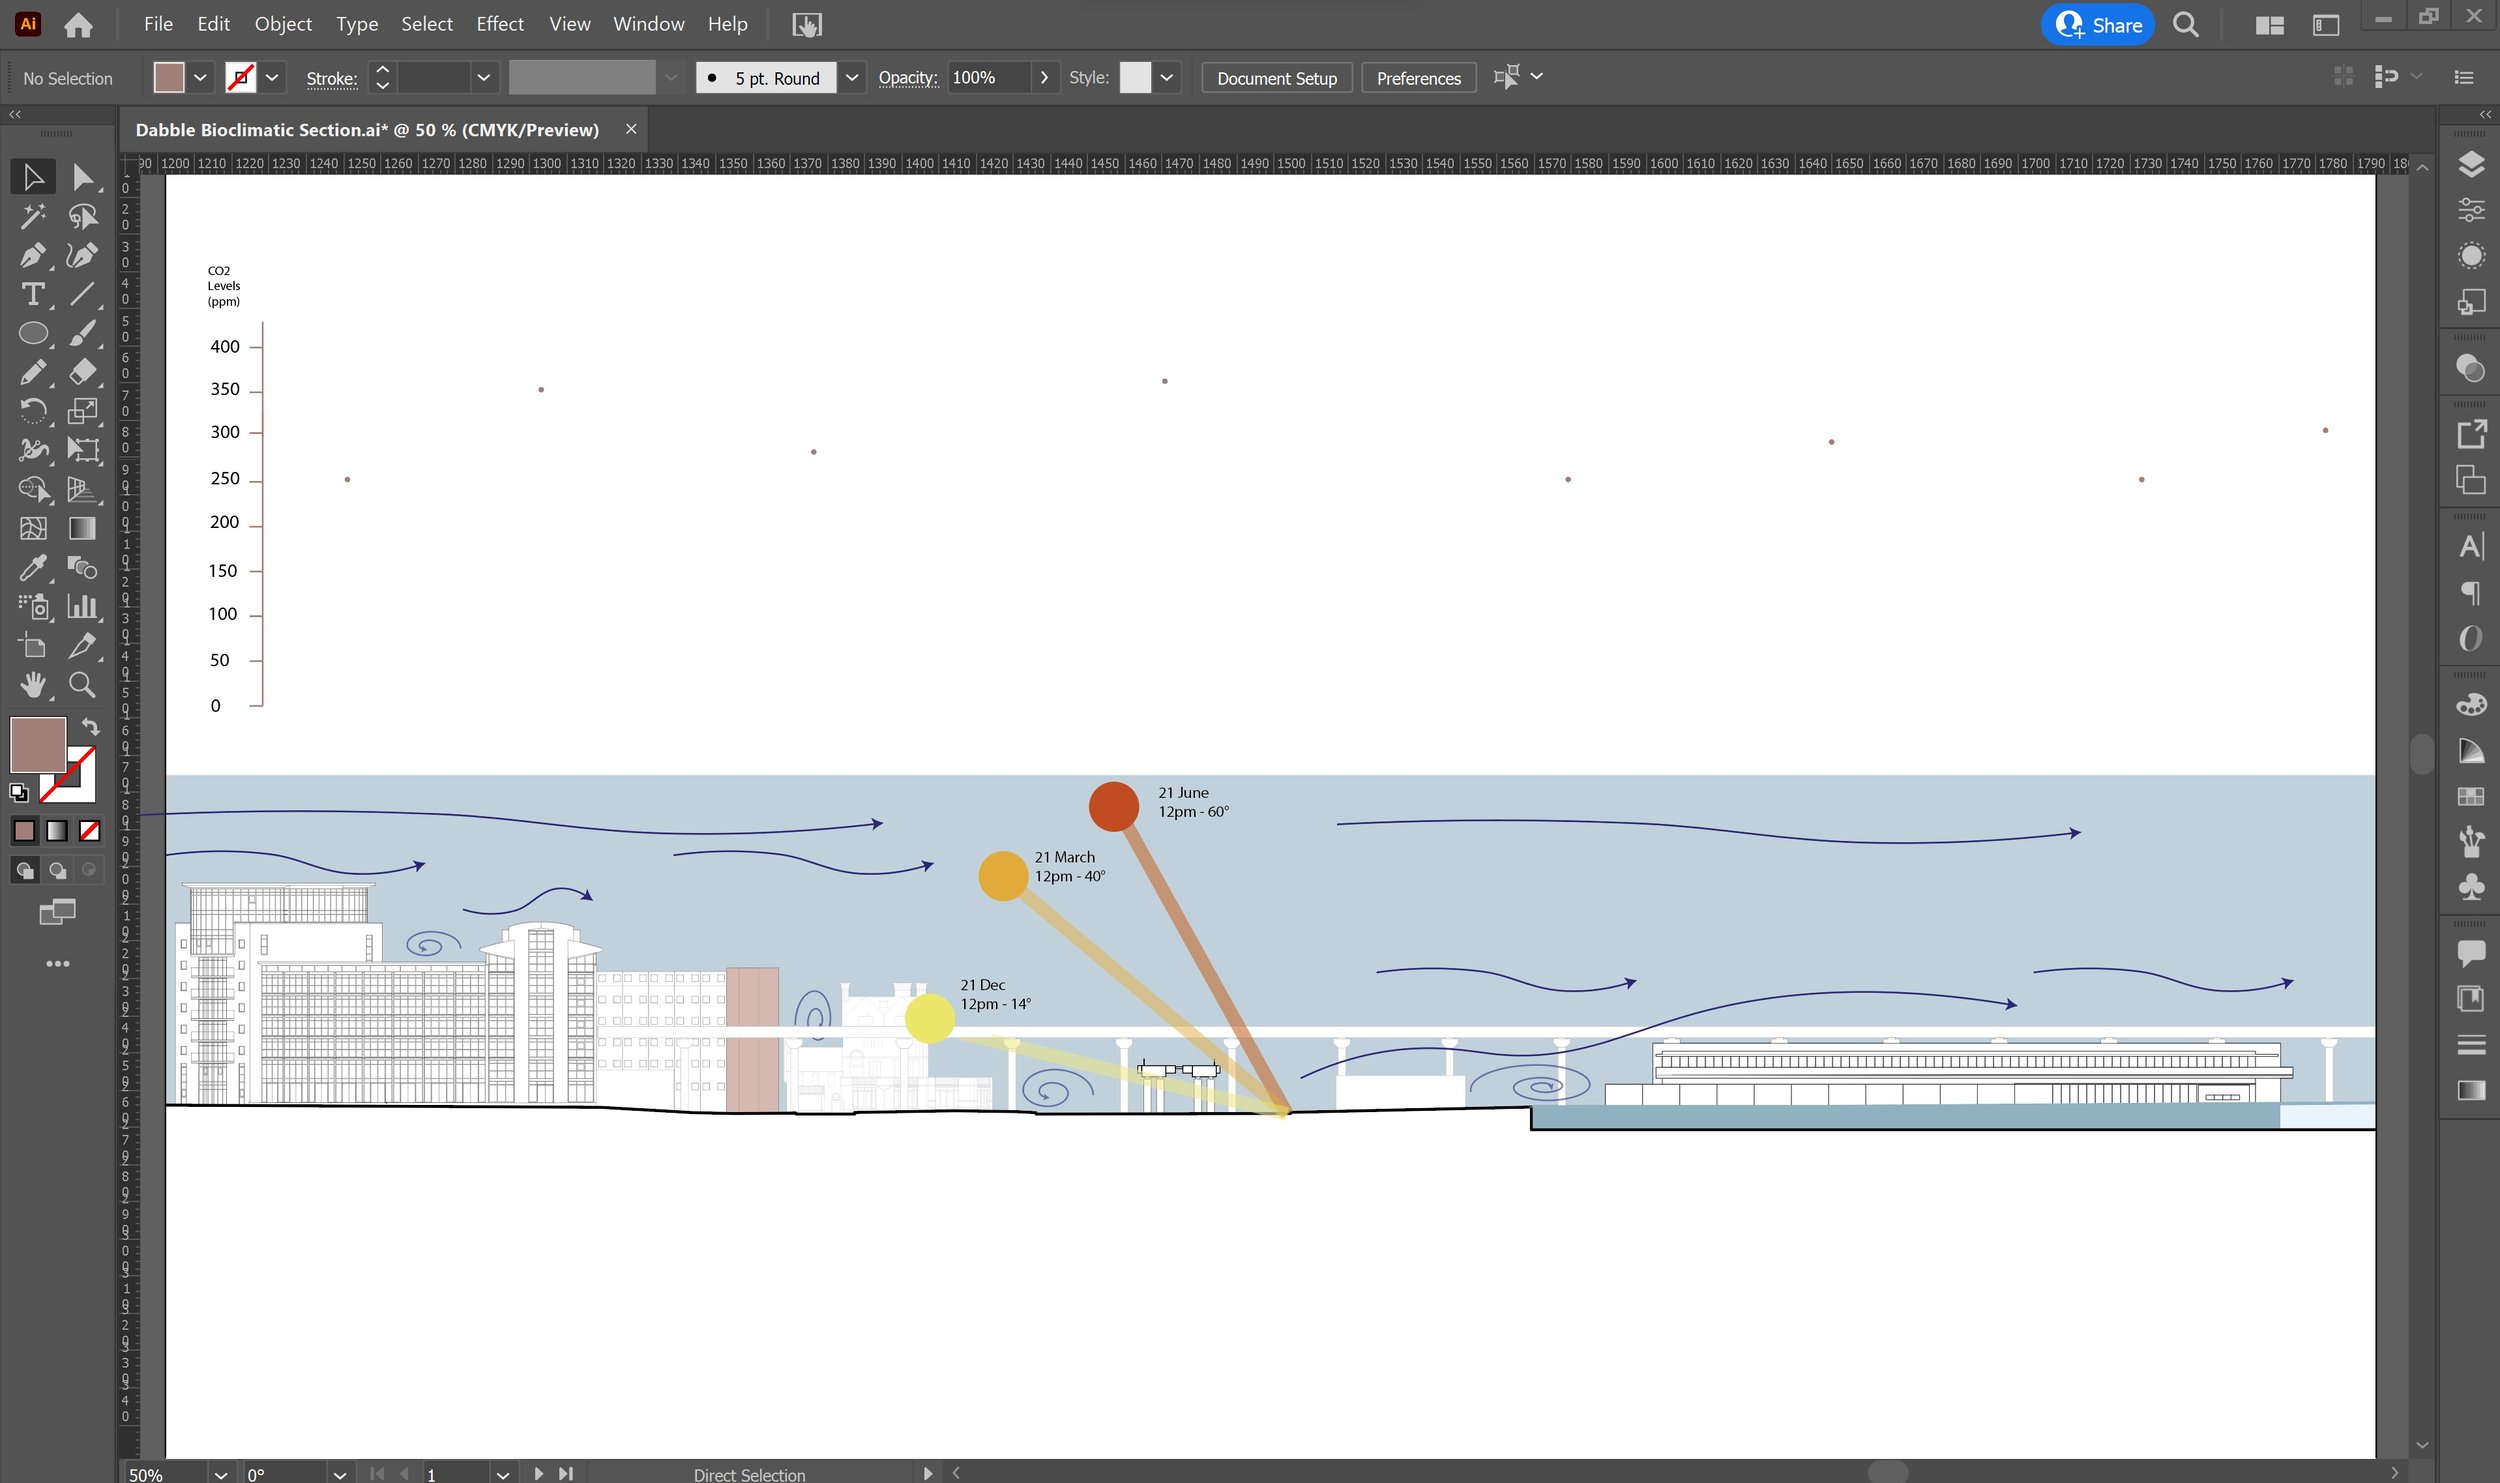
[2] Using one of the shape tools, plot points across your section according to the location of your spot measurements of CO2 levels on site, setting the height corresponding to the graph on the side of your section.
[3] You can join these up with the pen tool to convey how these conditions change as you move through the journey of your site set out by your section.
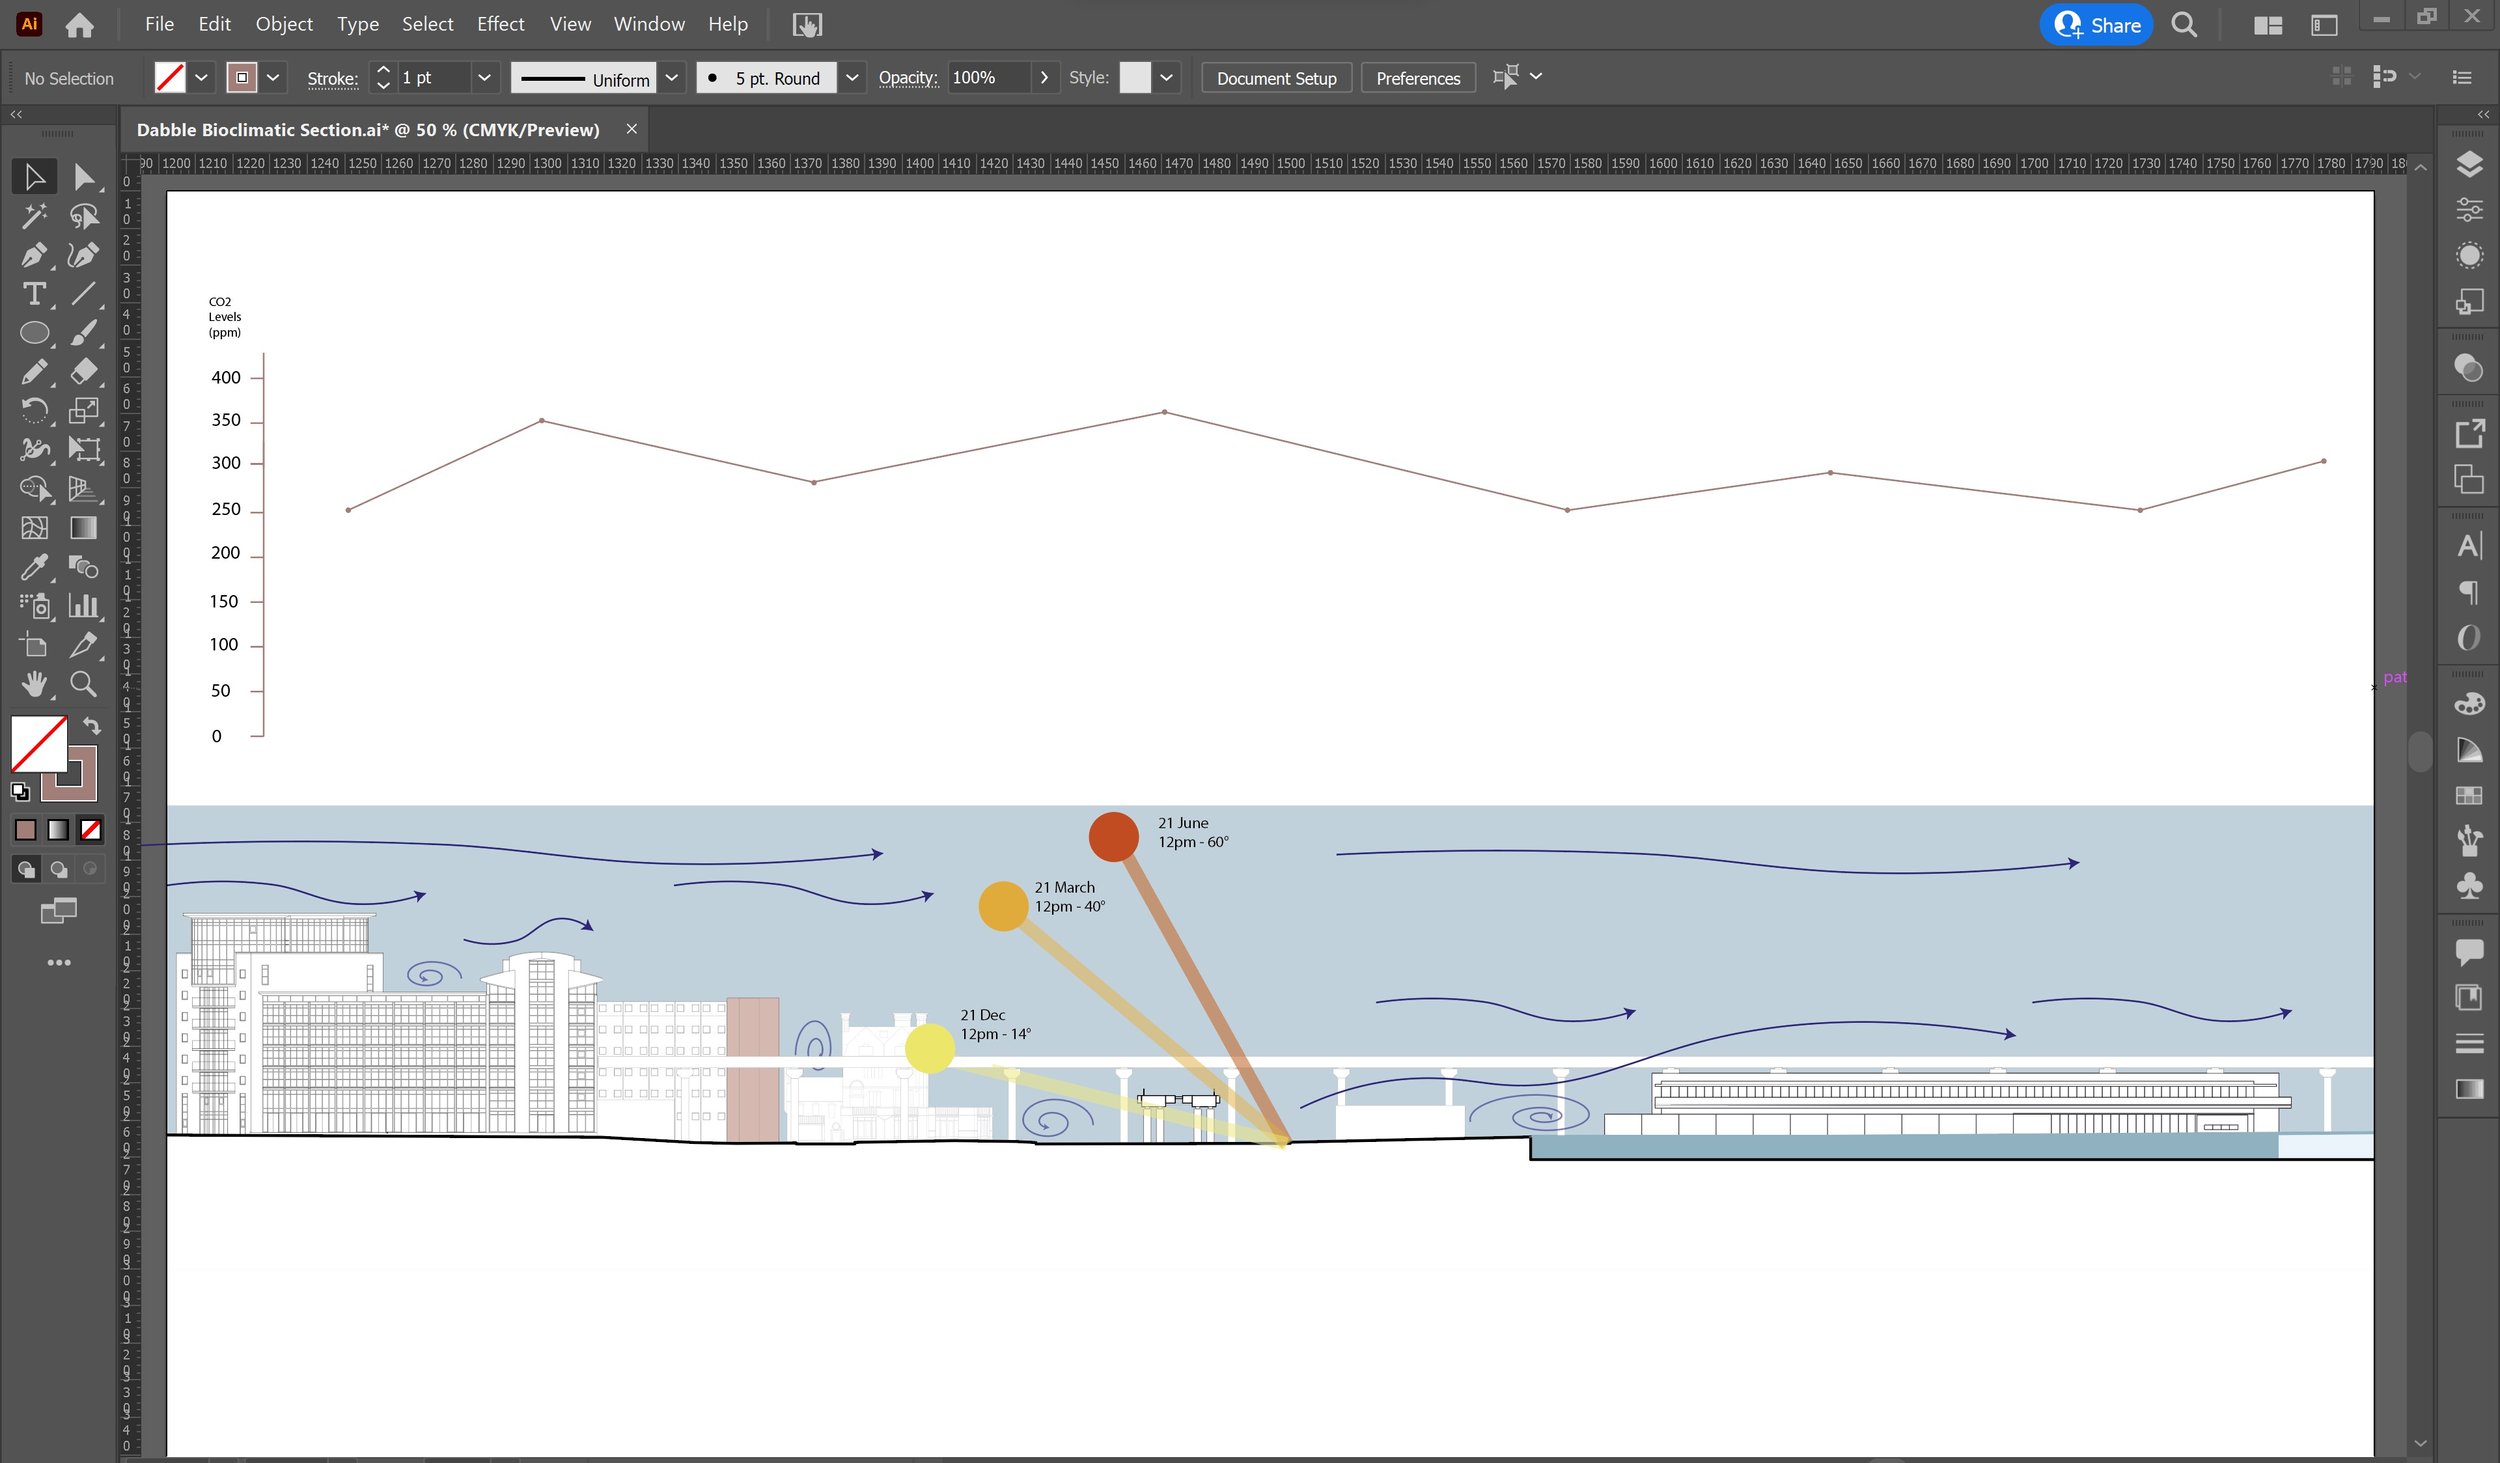
You can repeat these steps with other graphical information you want to convey in your section.
Convey conditions through narrative details
As much as the bioclimatic section is a technical drawing, there are more qualitative ways you can demonstrate the environmental conditions on your site drawing. This is most effective if you are producing a series of bioclimatic sections for different times of the year, rather than overlapping all your data onto one big section.
For example, showing trees that are blown in a certain direction by the wind can help to convey wind speed and direction, and the intensity of this effect across each section can demonstrate how the wind velocity changes across the year. Adding people in your section that are carrying out particular activities such as carrying an umbrella or wearing certain clothes that convey the season (light clothes for summer and weatherproof clothes for winter) can add a narrative quality to your bioclimatic section. In sections which include the proposal, this can be taken one step further e.g. an open window and blowing curtains, a family in a living room gathering around a fireplace etc. This will show that you understand the impact of the microclimate on the users and their activities.
Check out our post-production tutorials in Illustrator and Photoshop for tips on how to add other details and export your drawing.
Learning from your bioclimatic section
It’s useful to have a bioclimatic section to summarise the environmental conditions of your site. However, it also serves as a tool to identify issues and opportunities on site that become clear when you overlay different environmental data on your section. For example, seeing wind and pollution data together can reveal places on site for architectural interventions that filter the air before it can be used for passive ventilation.
Understanding the environmental conditions on your site is the first step to making your project sustainable and improve its building performance, which a bioclimatic section facilitates greatly. It’s important to remember that there are other ways to produce this kind of representation, such as sourcing the data from online sources or digital environmental simulations; this is just one method of many to execute this.
You can check out our other software tutorials on the Tutorials section of our website here.
Don’t have any CAD blocks to populate your sections? Our CAD Store has you covered! Check out our wide variety of niche, focused CAD Packs for a range of purposes to suit your plans, sections and elevations.
And, as always, see you next Friday for another blog post!